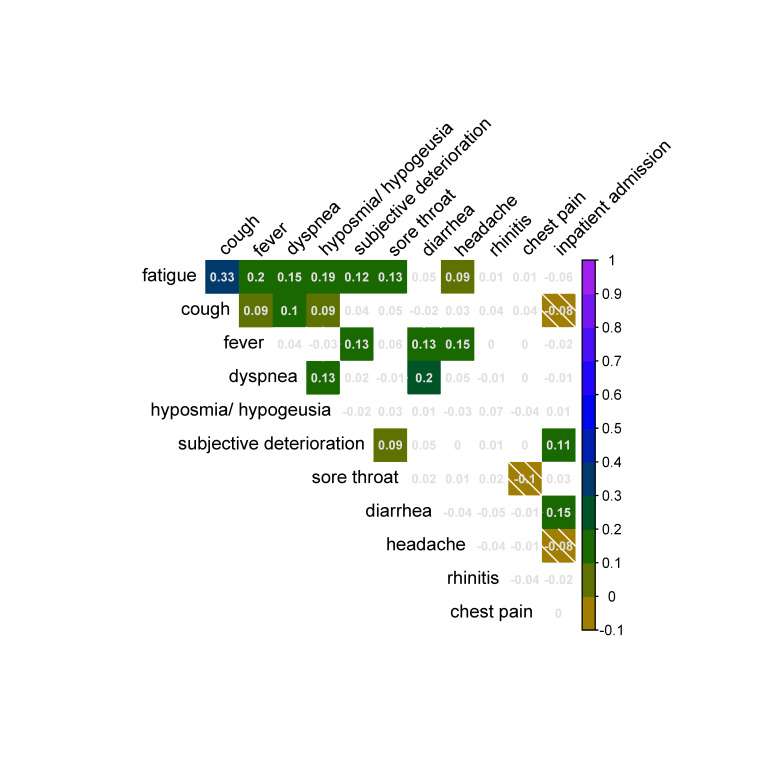
Fig 6. Positive and negative correlation of symptoms observed in individual patients.
Shown are all pairwise correlations, significant correlations are indicated by a background color (FDR≤0.05). Color codes in the color bar represent the size of the correlation coefficient r. Anti-correlation of symptoms (r≤0) is emphasized with diagonal stripes.

