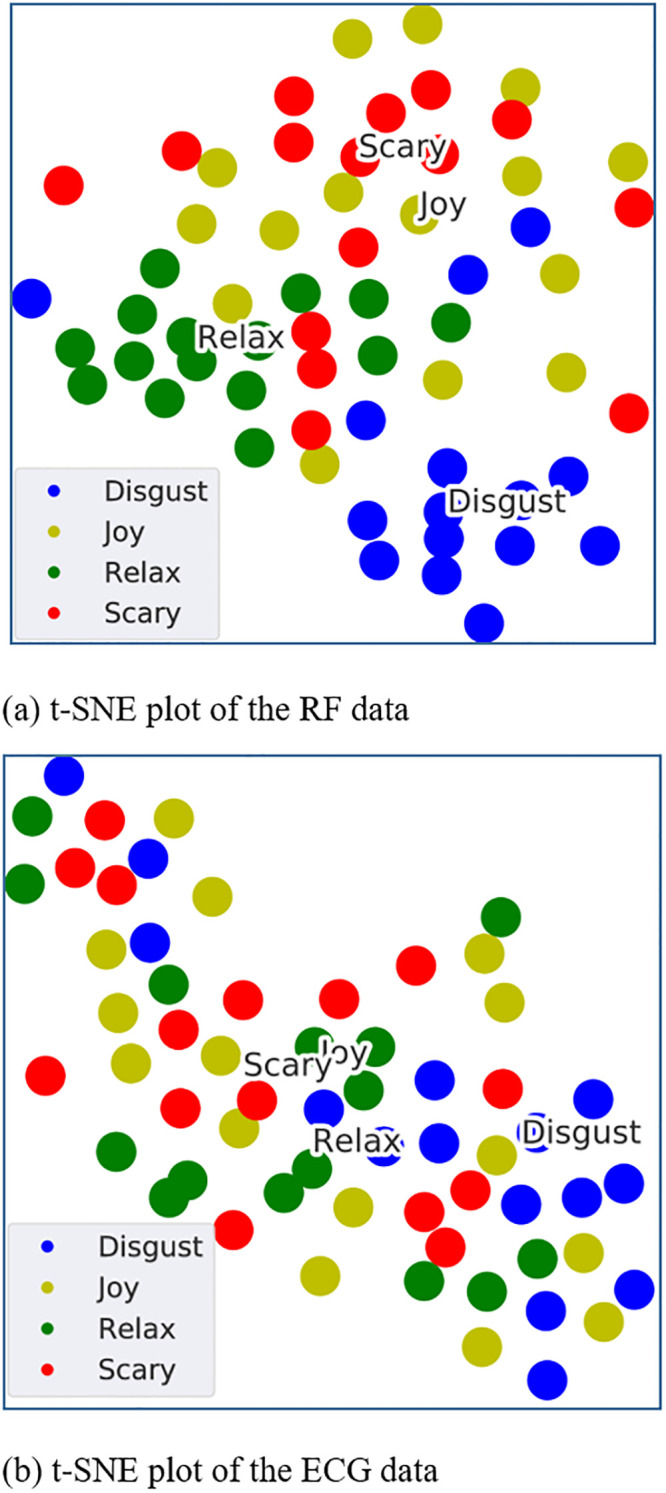
Fig 4. t-SNE plots representing the full RF and ECG databases.

The plots were obtained by reducing the dimensions of the continuous wavelet images of each signal. It can be observed that the wavelet images of RF signals (panel (a)) demonstrate a better separability between emotions than that of ECG signals (panel (b)).
