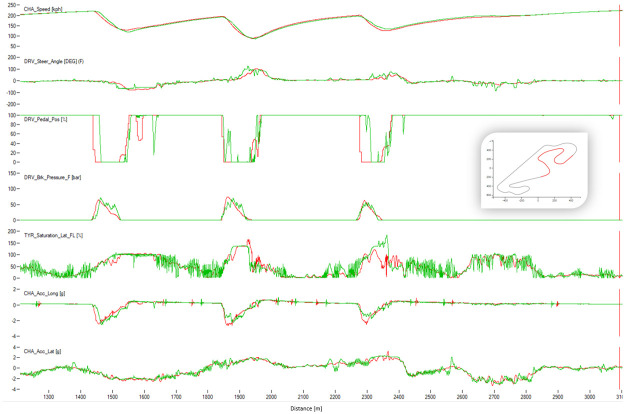
Fig 17. Comparison between the best human lap (red) and the best result of the algorithm (green).
The image shows Sector II of Barcelona. The X-axis represents distance through the racing line. The Y-axis (from top to bottom): Vehicle speed, steering wheel angle, throttle position, brake position, front left tire saturation, lateral acceleration, longitudinal acceleration.

