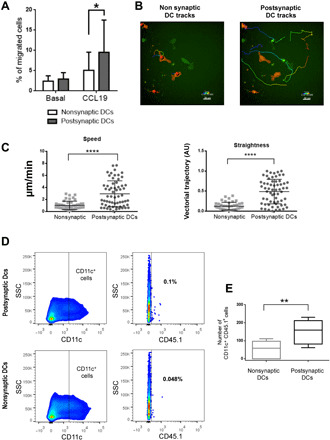
Fig. 4. IS enhances psDC migratory capacity in response to Ccr7.

(A) Transwell assay of psDCs and nsDCs in response to CCL19 (100 ng/ml) for 3 hours. Medium without cytokines was set as a control (basal). Cell numbers were normalized to the initial input of cells (n = 6; Wilcoxon matched-paired signed ranks test; *P < 0.05). (B) Image showing the tracks and speed (color coded) of psDCs (green) versus nsDCs (red) in an under-agarose assay in response to a CCL19 gradient (focus on the right side of the image). (C) Quantification of the speed and straightness of the chemotactic movement of DCs in the under-agarose assay (n ≥ 44, Student’s t test; ****P < 0.0001). (D) Dot plot describing the gating strategy for the analysis of the number of CD11c+ (gated in the CD3− population) and CD45.1+ cells in psDCs and nsDCs. (E) Quantification of the number of migrated psDCs and nsDCs in the popliteal lymph node is shown (n = 5, paired t test; **P < 0.01).
