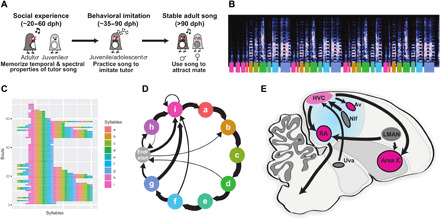
Fig. 1. Overview of zebra finch song learning and neural circuits for song.

(A) Timeline of zebra finch song learning in juvenile males. (B to D) Example representations of an adult zebra finch song; each color represents a syllable or note in the song. (B) Spectrogram of an adult male’s song. The y axis represents the frequency range (0 to 11.025 kHz), while the x axis represents total duration (5.27 s), and the colors reflect the amplitude. Colored bars underneath indicate introductory notes (pink, i) and syllables (a to h). (C) A syntax raster plot showing the syllables sung over repeated song bouts; colors reflect the syllables produced. (D) A representation of song syntax, with thickness of arrows representing the probability of syllable transitions. (E) Parasagittal schematic of the song circuit, with relevant nuclei labeled: Area X, striato-pallidal basal ganglia nucleus; Av, nucleus avalanche; HVC, premotor song nucleus; LMAN, lateral magnocellular nucleus of the anterior nidopallium; NIf, nucleus interfacialis of the nidopallium; Uva, nucleus uvaeformis; RA, robust nucleus of the arcopallium.
