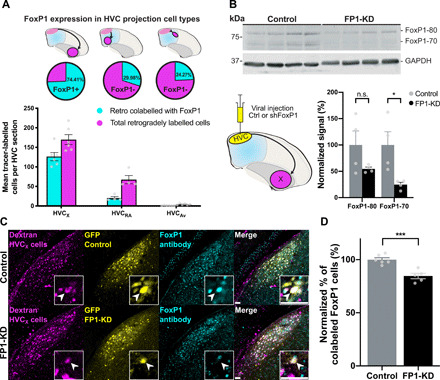
Fig. 2. FoxP1 expression and knockdown in HVC.

(A) FoxP1 expression in different classes of HVC projection neurons. (Top) Schematics of retrograde injections, (middle) the proportion of cells that express FoxP1 for each cell type, and (bottom) FoxP1-expressing neurons for each HVC subtype, per HVC section (HVCX: 74.4 ± 2.2%, n = 3 birds, 6 hemispheres; HVCRA: 30.0 ± 0.7%, n = 2 birds, 4 hemispheres; HVCAv: 24.3 ± 2.5%, n = 3 birds, 6 hemispheres). (B) Western blot using a custom-made rabbit anti-FoxP1 antibody (59) of lysates from HVC injected with control (rAAV9/ds-CBh-GFP) (Ctrl) or shFoxP1 AAV (pscAAV-GFP-shFoxP1) (FP1-KD). (Bottom, left) Schematic of viral injections of control (n = 4 birds) or shFoxP1 (n = 4 birds) groups. (Bottom, right) Graph shows quantification of FoxP1 protein. Signals were normalized to GAPDH, averaged for each condition, and normalized to the controls. Histograms represent average ± SEM (FoxP1-80: control: 100 ± 26.6% versus FP1-KD: 54.7 ± 3.5%, Student’s t test with Bonferroni-Sidak correction for multiple comparisons, P > 0.05; FoxP1-70: control: 100 ± 25.0% versus FP1-KD: 24.7 ± 4.4%, Student’s t test with Bonferroni-Sidak, P = 0.027). n.s., not significant. (C) Representative examples of HVC sections from control (top) and FP1-KD (bottom) birds. Injections were performed as in schematic in (B). HVCX cells labeled with retrograde tracer in Area X (magenta, left), GFP signal from AAV-control/AAV-shFoxP1 injection (yellow, middle left), FoxP1 staining with antibody (cyan, middle right), and a merged composite (right). Inset boxes indicate example cell per condition, and arrowheads indicate the soma of the example neurons. Scale bars, 50 μm. (D) Quantification of (C), showing the difference in colocalization between control (n = 3 birds, 6 hemispheres) and FP1-KD (n = 3 birds, 5 hemispheres), as the normalized percentage of tracer-labeled cells that express FoxP1. Bar graphs represent average ± SEM (control: 100 ± 1.8% versus FP1-KD: 84.59 ± 2.52%, Student’s t test, P = 0.0006).
