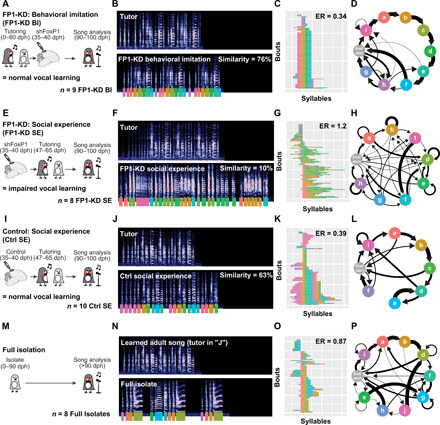
Fig. 3. Song learning is impaired by FoxP1 KD.

(A, E, I, and M) Timelines illustrating tutoring experience of FP1-KD behavioral imitation (A), FP1-KD social experience (E), control social experience (I), and full isolate birds (M). (B, F, J, and N) Representative spectrograms from a single bird belonging to each experimental group and their tutor. All spectrograms are 5.27 s in duration and reflect a frequency range of 0 to 11.025 kHz. Colored underlines reflect syllable labels used for subsequent syntax visualizations and analysis. Similarity refers to percentage similarity to tutor; group comparisons in Fig. 4. The full isolate bird (N) had no tutor and therefore has no similarity to tutor score. It is contrasted with the song of an adult zebra finch with typical tutor exposure. (C, G, K, and O) Syntax raster plots illustrating the syntax stereotypy of an example bird for each condition. This is the same bird used for the spectrogram and syntax diagram. Each row reflects a single song bout, and each colored block reflects the syllable sung at that position in the bout. Rows are sorted according to syllable order. ER, entropy rate; group comparisons in Fig. 4. (D, H, L, and P) Diagrams reflecting syllable transitions produced by an example bird for each condition. Line thickness is proportional to the transition probability from the originating syllable to the following. Transitions with a probability of less than 4% are omitted for clarity.
