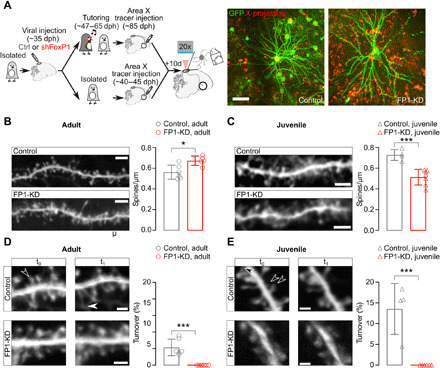
Fig. 5. FP1-KD reduces structural plasticity on HVCX neurons.

(A) Left: Schematic of the experimental protocol and timeline of the experiments. Right: In vivo two-photon images of sample GFP-labeled (green) and retrogradely labeled (red) control and FP1-KD HVCX neurons. Scale bar, 50 μm. (B) Left: Representative in vivo two-photon images of GFP-expressing dendrite sections from control (top) and FP1-KD (bottom) normally reared adult HVCX neurons. Scale bar, 5 μm. Right: Average ± SEM dendritic spine density (spines per micrometer) from adult HVCX neurons (control adult: 0.56 ± 0.03, n = 821 spines, 6 cells, 2 animals; FP1-KD adult: 0.67 ± 0.02, n = 668 spines, 6 cells, 5 animals; Student’s t test, P = 0.01). (C) Left: Representative in vivo two-photon images of GFP-expressing dendrite sections from control (top) and FP1-KD (bottom) juvenile isolate HVCX neurons. Scale bar, 5 μm. Right: Average ± SEM dendritic spine density (spines per micrometer) from juvenile HVCX neurons (control juvenile: 0.73 ± 0.03, n = 769 spines, 4 cells, 3 animals; FP1-KD juvenile: 0.51 ± 0.03, n = 745 spines, 6 cells, 5 animals; Student’s t test, P < 0.001). (D) Left: Control and FP1-KD adult dendritic segments from HVCX neurons taken at two different times (t0,t1 across a 4-hour imaging interval). Filled and empty arrowheads indicate gained and lost spines, respectively. Scale bars, 2 μm. Right: Average ± SEM percent dendritic spine turnover (acquired + lost spines/total spines counted) from control and FP1-KD adults (control adult: 4.3 ± 0.8%, n = 1126 spines, 6 cells, 2 animals; FP1-KD adult: 0.0 ± 0.0%, n = 1148 spines, 6 cells, 5 animals; Student’s t test, P < 0.001). (E) Left: Representative images of control and FP1-KD juvenile dendritic segments from HVCX neurons, taken at two different times (t0,t1 across a 2-hour imaging interval). Scale bars, 2 μm. Right: Average ± SEM percent dendritic spine turnover (control juvenile: 13.6 ± 3.1%, n = 650 spines, 4 cells, 3 animals; FP1-KD juvenile: 0.0 ± 0.0%, n = 735 spines, 6 cells, 5 animals; Student’s t test, P < 0.001).
