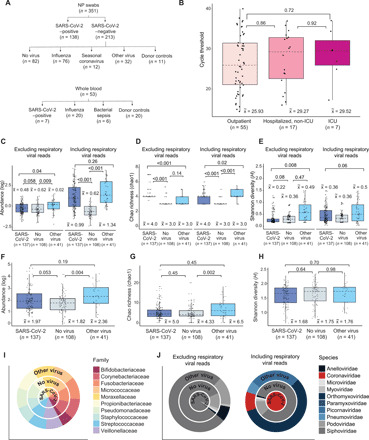
Fig. 1. Overview of sample collection and metatranscriptomic analysis.

(A) Flowchart of NP swab and WB sample collection. (B) Box and whisker plots of RT-PCR cycle threshold (Ct) values of SARS-CoV-2–positive individuals who are outpatients (n = 55) were compared with those who are hospitalized, non-ICU (n = 17), or in the ICU (n = 7). There was no difference in viral load, inversely related to the Ct value, regardless of disease severity [P = 0.89 by analysis of variance (ANOVA)]. (C to E) Box and whisker plots of abundance (C), Chao richness (D), and Shannon diversity (E) of the viral metatranscriptome in patients with SARS-CoV-2 (COVID-19) (n = 137), respiratory viruses (“Other virus”) (n = 41), and without respiratory viruses (“No virus”) (n = 108), stratified by the inclusion (“Including respiratory viral reads”) or exclusion (“Exclusion respiratory viral reads”) of respiratory viral reads. (F to H) Box and whisker plots of abundance (F), Chao richness (G), and Shannon diversity (H) of the bacterial metatranscriptome. (I) Distribution of viral families in each group, expressed as log10-normalized RPM. (J) Distribution of the top 10 bacterial families in each group. For box and whisker plots, the median is represented by a dotted line, boxes represent the first to third quartiles, whiskers represent the minimum and maximum values, and jitters represent the distribution of the population. For (C) to (H), statistical analysis was conducted by Kruskal-Wallis test, followed by the Nemenyi test for post hoc analysis.
