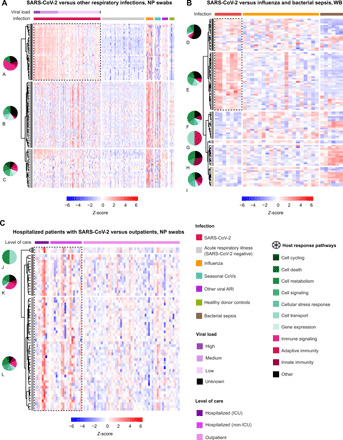
Fig. 5. Hierarchically clustered heatmaps of DEGs.

(A) NP swab DEGs from patients with infection by SARS-CoV-2 compared with influenza, seasonal coronaviruses, and other respiratory viruses, or virus-negative patients. Samples are stratified by diagnosis (“Infection”) and highest level of care (“Level of care” including outpatient, hospitalized, non-ICU, and ICU). (B) WB DEGs from patients with infection by SARS-CoV-2 compared with influenza, bacterial, and bacterial sepsis. Samples are stratified by diagnosis (“Infection”). (C) Comparison of DEGs among outpatients and hospitalized patients admitted (“ICU”) or not admitted (“non-ICU”) to the ICU. For (A), DEGs with Bonferroni-corrected P value <0.001 were included. For (B) and (C), DEGs with Bonferroni-corrected P value <0.01 were included. All noncoding genes were removed. For (A), DEGs are calculated relative to individuals with nonviral ARIs, and the top 100 DEGs are included; for (B), DEGs are calculated relative to donor controls, and the top 100 DEGs are included; for (C), DEGs are calculated on the basis of pairwise comparisons between outpatients and hospitalized patients, and all DEGs are included. Up-regulated genes are colored in red, and down-regulated genes are colored in blue. The distribution of predicted pathways (“Host response pathways”) is shown by pie graphs above each group in the heatmap; cellular functions are indicated in shades of green, immune functions are indicated in shades of red, and other pathways are indicated in black. DEG groups (A to L) were identified on the basis of hierarchical clustering with complete linkage, after exclusion of noncoding genes. The lettering is presented in alphabetical order, starting with A in the top left corner. Dotted outlines highlight key DEG groups, which are distinctly up-regulated in SARS-CoV-2 infection compared with other disease states.
