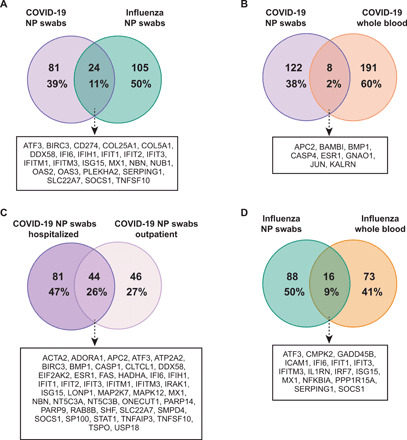
Fig. 6. Venn diagrams of DEGs.

(A) Comparison of NP swab DEGs in patients with SARS-CoV-2 and influenza. (B) Comparison of NP swab and WB DEGs in patients with SARS-CoV-2. (C) Comparison of NP swab DEGs in COVID-19 outpatients and hospitalized patients. (D) Comparison of NP swab and WB DEGs in patients with influenza. The DEGs are calculated relative to donor controls.
