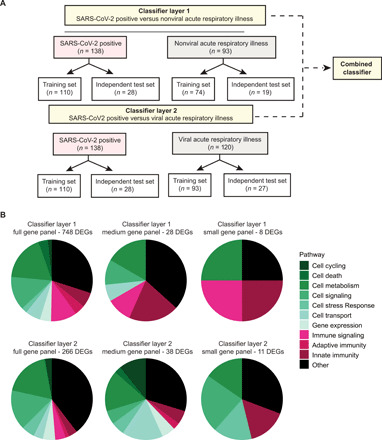
Fig. 7. Diagnostic classifier for COVID-19.

(A) Overview of classifier design and distribution of samples for training and test sets in layers 1 and 2. (B) Pie graphs showing the distribution of predicted pathways (“Host response pathways”) represented by the genes within the full gene panel (left), medium gene panel (middle), or the small gene panel (right).
