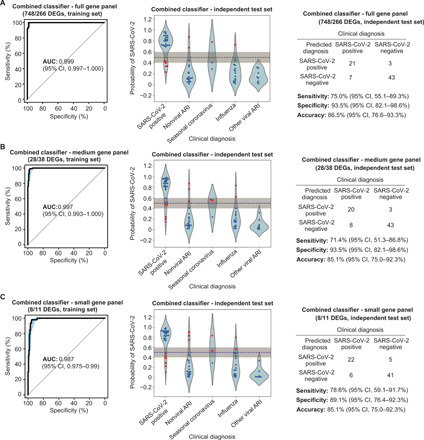
Fig. 8. Performance characteristics of the two-layered (combined layers 1 and layer 2) classifier for full, medium, and small gene panels.

(A to C) Training set ROC curve (left) and test set violin plot (middle) and confusion matrix (right) for the two-layer classifier, using either the full gene panel (A), medium gene panel (B), or the small gene panel (C).
