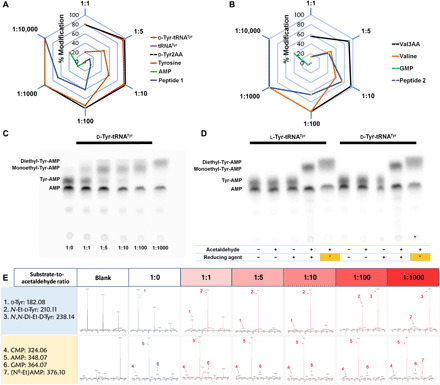
Fig. 8. aa-tRNAs are hypersensitive to acetaldehyde.

(A and B) Radar charts showing that aa-tRNA (d-Tyr-tRNATyr) and its analogs (d-Tyr2AA and Val3AA) are hypersensitive to acetaldehyde than other biomolecules (each corner represents the ratio of substrate to acetaldehyde, and hexagonal rings depict the percentage of the extent of modification. Related MS data are shown in (E) and figs. S7 and S8D. (C) TLC is showing differential migration of d-Tyr-tRNATyr at the different substrate-to-acetaldehyde ratios. aa-tRNA corresponding spot was observed at 1:0; monoethyl-aa-tRNA corresponding spots were observed at 1:1, 1:5, 1:10, and 1:100; and complete diethyl-aa-tRNA corresponding spot was observed at 1:1000 substrate-to-acetaldehyde ratios [related MS data are shown in (E)]. (D) TLC is showing differences in the spot positions of aa-AMP corresponding to the unmodified, monoethyl, and diethyl-Tyr-tRNATyr [lanes include untreated aa-tRNA, aa-tRNA incubated with only acetaldehyde, aa-tRNA incubated with only reducing agent, aa-tRNA incubated with both acetaldehyde (1:5 substrate-to-acetaldehyde ratio) and reducing agent, and aa-tRNA incubated with both acetaldehyde (1:1000 substrate-to-acetaldehyde ratio and it is indicated as asterisk in the figure) and reducing agent, respectively]. (E) MS data related to (C) (corresponding MS2 data are shown in fig. S8A).
