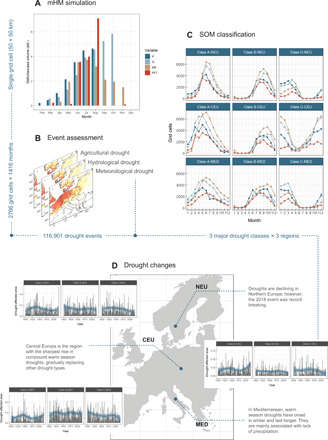
Fig. 1. Classification of drought events.

(A) The mHM simulation produces time series of runoff and soil moisture using precipitation and temperature at each grid cell (50 × 50 km). (B) Three types of drought (meteorologic, hydrological, and agricultural) are determined, and the events that last for at least 3 months are assessed for each grid cell. (C) The machine learning classification scheme reduces the dimensionality of the issue to three major drought classes for NEU, CEU, and MED. The borders of the three regions are presented in fig. S1. Each pointed line represents the number of grid cells under drought due to deficit in precipitation (P), runoff (Q), and soil moisture (SM) or excess PET [colors are as in (A)]. (D) The temporal evolution of annual drought coverage per class and region highlights current drought dynamics (loess regression).
