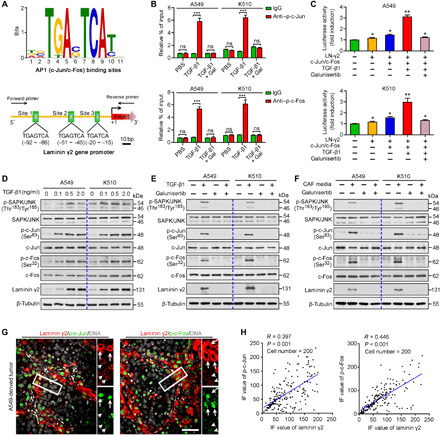
Fig. 3. Ln-γ2 expression is transcriptionally activated by TGF-β1 via JNK/AP1 signaling.

(A) AP1 (including c-Jun/c-Fos) transcriptional binding sites in the Ln-γ2 gene promoter. (B) ChIP-qPCR analysis showing that TGF-β1 stimulation promoted the binding of phosphorylated c-Jun (p-c-Jun) and phosphorylated c-Fos (p-c-Fos) to the Ln-γ2 gene promoter, and these changes were inhibited by galunisertib (10 μM). (C) Luciferase reporter assay showed that TGF-β1 transcriptionally up-regulated Ln-γ2 expression by activating AP1 in A549 and KYSE510 cells. (D) The levels of phosphorylated SAPK/JNK (p-SAPK/JNK), p-c-Jun, and p-c-Fos in tumor cells treated with different concentrations of TGF-β1 were analyzed using Western blotting. (E) Western blotting confirmed that the activation of JNK/AP1 signaling by TGF-β1 (0.5 ng/ml) stimulation was inhibited by galunisertib (10 μM). (F) CAF-conditioned media activated JNK/AP1 signaling in A549 and KYSE510 cells, which was also be blocked by galunisertib (10 μM). (G) Coexpressions of Ln-γ2 (red) with p-c-Jun (green) or p-c-Fos (green) in xenografted tumors derived from A549 cells were shown by double IF staining. Cell nuclei were stained with DAPI (gray). The white long and short arrows indicate the high and low expression of Ln-γ2, respectively. Scale bar, 50 μm. (H) The intensity of IF staining for p-c-Jun, p-c-Fos, and Ln-γ2 in tumor (cell number n = 200) was analyzed with ImageJ software, and a linear regression analysis was performed to test their correlations. In (B) and (C), statistical analyses were performed using unpaired two-tailed t tests with Welch’s correction. Data are presented as means ± SD. *P < 0.05, **P < 0.01, and ***P < 0.001. ns, no significant difference. In (D) to (F), β-tubulin was tested as a loading control.
