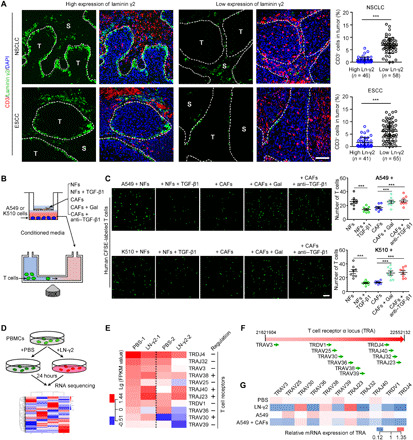
Fig. 4. High Ln-γ2 is responsible for T cell exclusion.

(A) Double IF staining for Ln-γ2 (green) and CD3 (T cells, red) in NSCLC and ESCC tissues. Cell nuclei were counterstained with DAPI (blue). The boundary of tumor and stroma was marked with white dotted lines. Scale bar, 100 μm. The proportions of these T cells in tumor nests were counted in tumor tissues with high or low expression of Ln-γ2. (B) Schematic of the T cell chemotaxis assay. (C) Representative images of migratory T cells (green) labeled with CFSE. Scale bar, 20 μm. The number of migratory T cells was counted in the right panel. (D) RNA-seq was conducted to explore the gene expression in T cells regulated by Ln-γ2. (E) Heat map showing that Ln-γ2 significantly regulated the expression of T cell receptor (TCR) family genes. −, downregulation; +, upregulation. (F) These TCR genes were located in the TCR α chain (TRA). (G) Quantitative real-time PCR (qRT-PCR) confirmed the regulation of TCR gene expression by Ln-γ2 and conditioned media from A549 cells alone or cocultured with CAFs. In (A) and (C), statistical analyses were performed using the unpaired two-tailed t test with Welch’s correction. Data are presented as means ± SEM; ***P < 0.001. ns, no significant difference.
