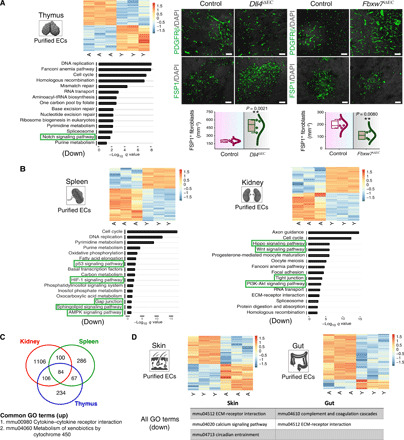
Fig. 6. Molecular changes in the aging endothelium.

(A) Heatmap (left) shows RNA-seq expression levels of differentially expressed genes between young (Y; 8- to 10-week-old) and aged (A; 50- to 55-week-old) thymus (FDR-adjusted P value cutoff of <0.01). The color intensity represents the row scaled normalized log2(CPM) expression, whereas the column represents the replicates. Red and blue color intensity indicates up-regulated and down-regulated genes. Bottom left showing the most significant down-regulated biological processes obtained from gene set enrichment. 3D images show PDGFRβ and FSP1 immunostaining in Dll4iΔEC and littermate control thymus as well as Fbxw7iΔEC and control thymus (11-week-old). Combo plots show fibroblast numbers (n = 4). (B) Heatmaps showing RNA-seq expression levels of differentially expressed genes between young (Y; 8- to 10-week-old) and aged (A; 50- to 55-week-old) spleen and kidney. Bottom shows the most significant GO terms of the down-regulated pathways. (C) Venn diagram of biological processes obtained from gene set enrichment analysis representing the up-regulated pathways from kidney, spleen, and thymus. (D) Heatmaps showing RNA-seq expression levels of differentially expressed genes between young (Y) and aged (A) skin and gut. Bottom shows the GO terms of the down-regulated pathways. Data represent means ± SD. The P value is derived from two-tailed unpaired t tests. **P < 0.01. Nuclei: DAPI. Scale bars, (A) 50 μm. ECM, extracellular matrix.
