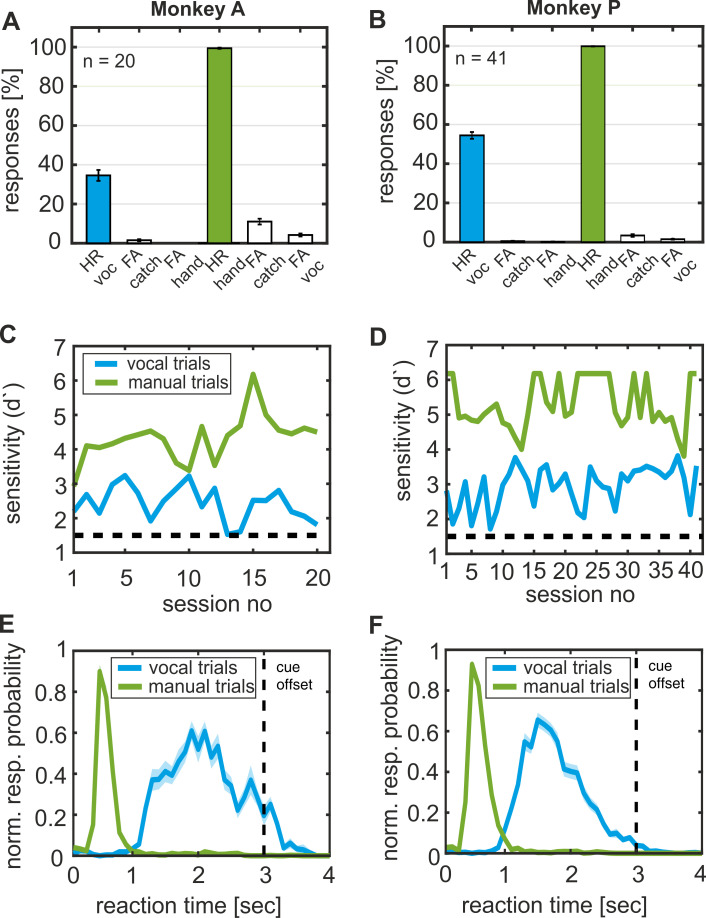
Figure 3. Behavioral performance.
(A, B) Distribution of ‘hit’ and ‘false alarm’ rates for each response type and animal separately, averaged over 20 sessions for Monkey A and 41 for monkey P. (C, D) Sensitivity of signal detection for ‘vocal’ and ‘manual’ trials indicated by the d’ prime value. The dotted line indicates the detection threshold of 1.5. (E, F) Response probability of ‘vocal’ and ‘manual’ responses in the corresponding trial type. Normalized and averaged response over sessions are shown. Shaded areas indicate first and third quartiles.

