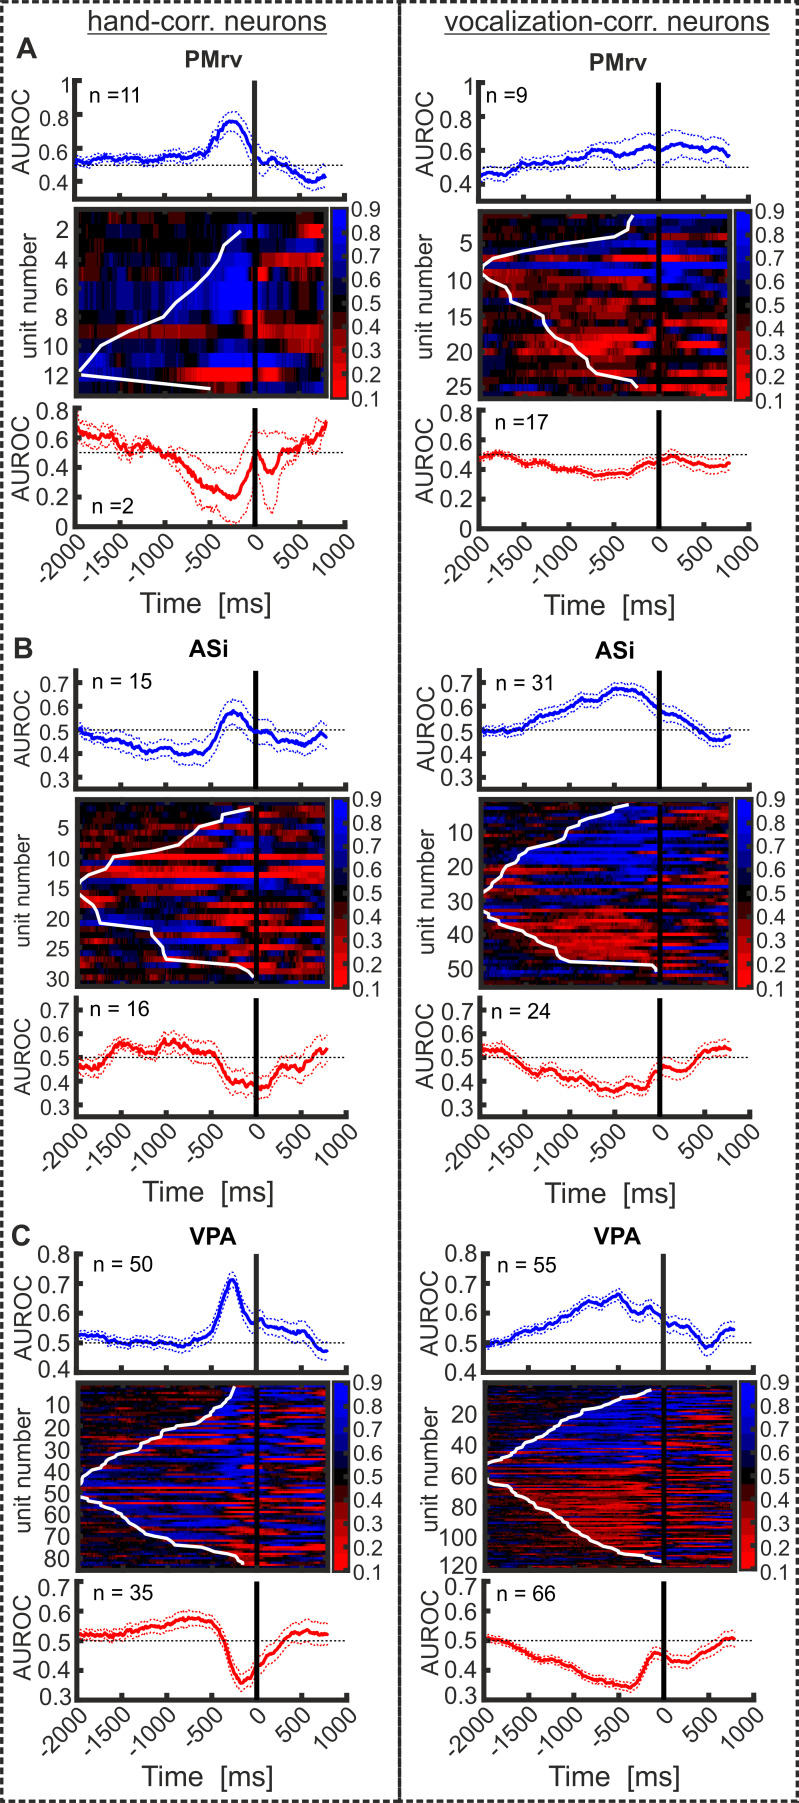
Figure 8. Quality and temporal evolution of response correlated activity for all hand-correlated neurons (left column) and all vocalization-correlated neurons (right column), recorded in PMrv (A), ASi (B), and VPA (C).
Neurons are sorted based in their activity profile (increased or decreased FR) in the pre-response period compared to baseline and the latency of response type coding. Top: average AUROC values of all hand- (left) or vocalization-correlated neurons (right) increasing their FR prior to ‘manual’ response. Middle: AUROC values of each individual hand- or vocalization-correlated neuron from 2000 ms before to 1000 ms after response onset. The black line at 0 ms indicates the response onset. The white line marks each neuron’s latency of response type discrimination. Bottom: average AUROC values of all hand- (left) or vocalization-correlated neurons (right) showing decreased activity prior to response onset. Dashed lines represent the s.e.m.

