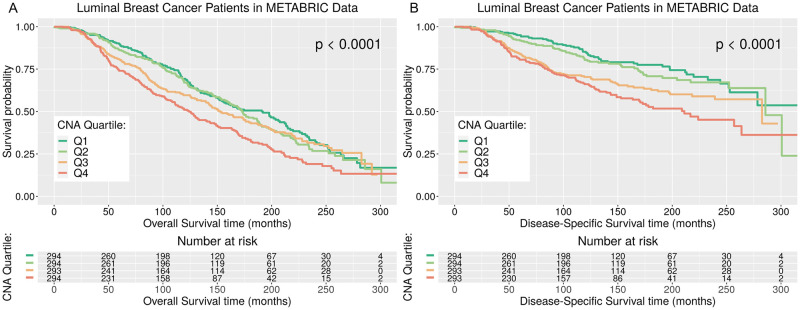
Fig 3. KM plots for OS and DSS for METABRIC luminal breast cancer patients in each CNA Quartile.
Kaplan Meier plots and risk tables for luminal breast cancer survival. Overall Survival (OS), Fig (A), and Disease Specific Survival (DSS), Fig (B), for METABRIC luminal breast cancer patients in each CNA Quartile. The p-value associated with the log-rank test and a risk table displaying the number of patients at risk at each time interval is displayed.

