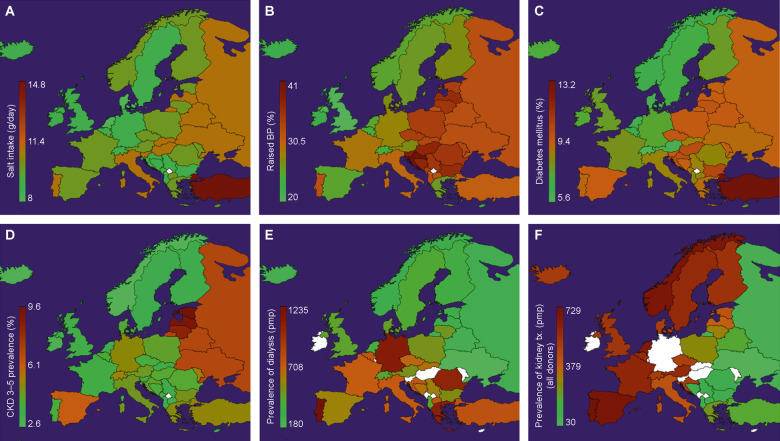
FIGURE 1.
Data reported for various countries in Eastern and Western Europe. (A) Variations in salt consumption. Prevalence of: (B) hypertension (raised blood pressure), (C) DM (raised blood glucose), (D) CKD Stages 3–5, (E) dialysis and (F) Tx. Data were obtained from several references [18, 20, 21, 26–28]. The colour scale from green to brown shows increasing prevalence; white denotes missing data in the ERA-EDTA Registry for those particular countries.

