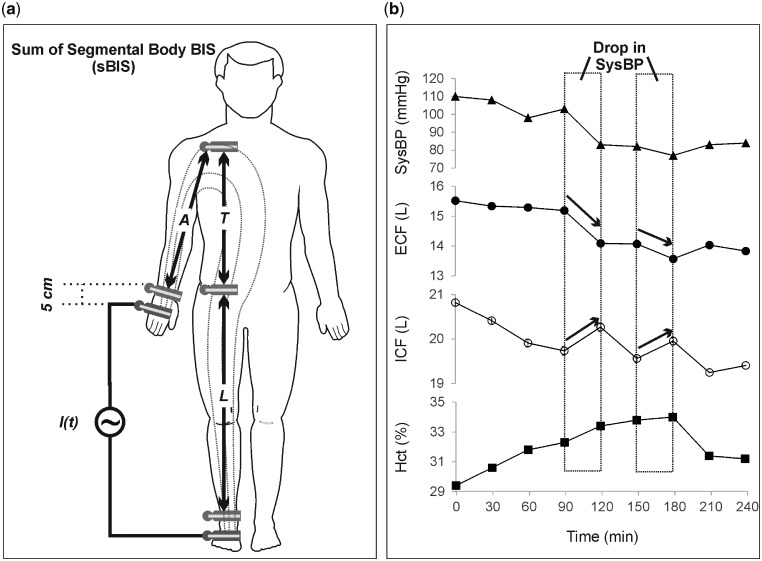
FIGURE 1.
Graph showing (a) the location of the electrodes for sBIS measurements and (b) the changes in ECF and ICF associated with a decrease in SysBP in a representative patient from the unstable group (aged 69 years, pre-dialysis weight 85.5 kg and dry weight 83 kg). A, arm; T, trunk; L, leg segment.

