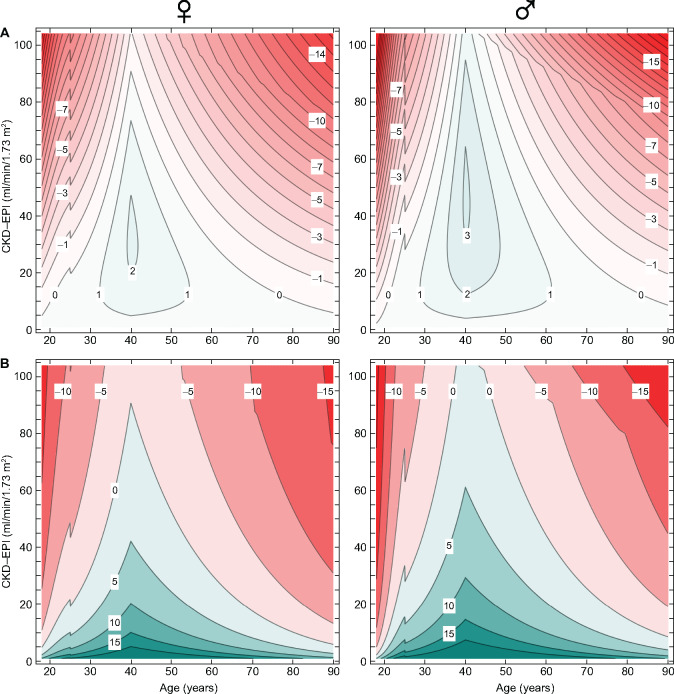
FIGURE 1:
Contour plots of absolute and relative differences between the EKFC and CKD-EPI equations as a function of age (x-axis) and CKD-EPI estimated GFR values (y-axis). Areas where EKFC eGFR is higher than CKD-EPI are shaded in green and areas where EKFC eGFR is lower are in red. (A) Absolute differences (EKFC − CKD-EPI, in mL/min/1.73 m2) for females and males. Contours are drawn for every 1 mL/min/1.73 m2 difference. (B) Relative differences [100 × (EKFC − CKD-EPI)/CKD-EPI, in percent] for males and females. Contours are drawn for every 5% difference.

