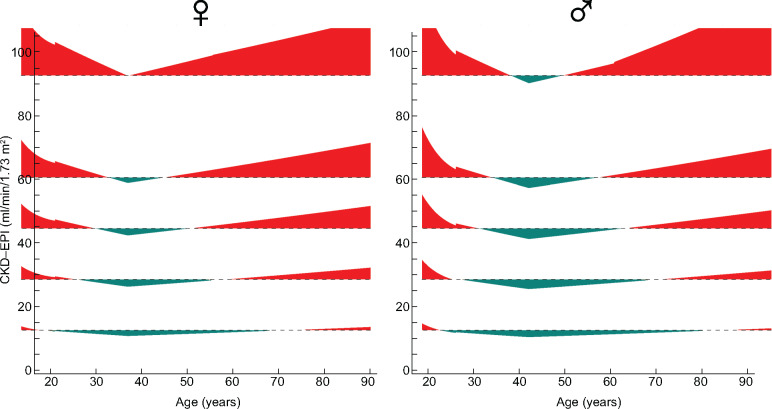
FIGURE 2:
Region plot showing discordant KDIGO GFR categories (G1, 2, 3a, 3b, 4 and 5) [3] between the EKFC and CKD-EPI equations as a function of age (x-axis) and CKD-EPI estimated GFR values (y-axis). Areas where the EKFC GFR category is lower than the CKD-EPI (i.e. kidney function is better) are colored green and areas where the EKFC GFR category is higher are colored red. In the white areas, KDIGO GFR categories are the same for both equations.

