
FIGURE 9:
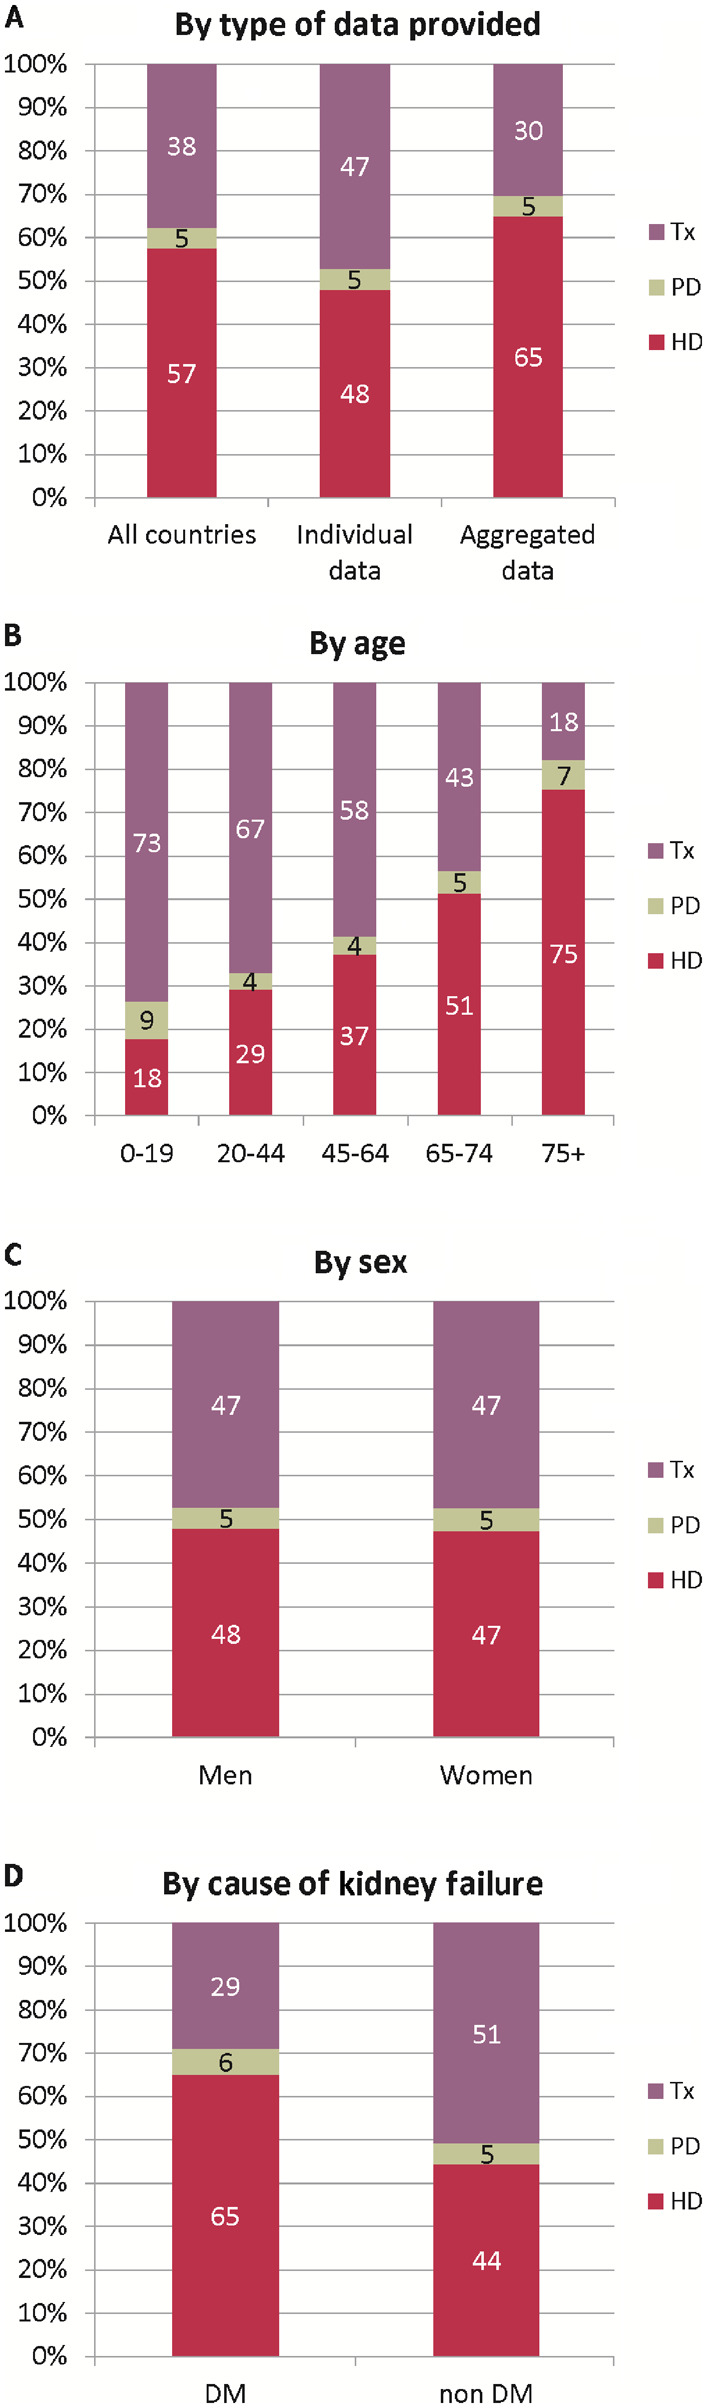
Treatment modality distribution by (A) type of data provided, (B) age, (C) sex and (D) cause of kidney failure (DM and non-DM) for prevalent patients on KRT on 31 December 2018. Parts (B), (C) and (D) are only based on the data from registries providing individual patient data. See Supplementary Appendix A1 for a list of countries and regions providing individual patient data or aggregated data. Tx, kidney transplant