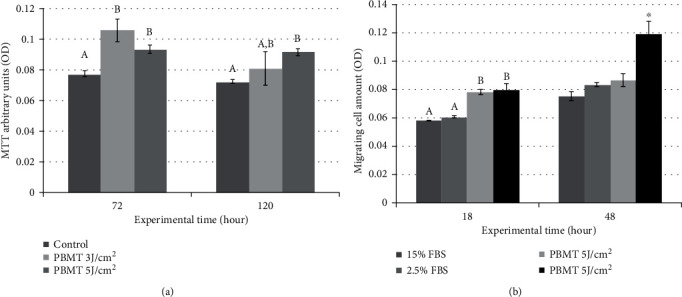
Figure 4.

(a) Graphical representation of the number of vital cells of all experimental groups in the function of time. Different letters show statistically significant differences between groups at 72 h, whereas different capital letters show statistically significant differences between groups at 120 h (p < 0.05). (b) Graphical representation of the number of migrating cells of all experimental groups at 18 and 48 hours after cell seeding. Different letters show statistically significant differences between groups at the experimental time of 18 hours. ∗Differences between the PBMT 5 J/cm2 group and all other groups at 48 hours (p < 0.0001).
