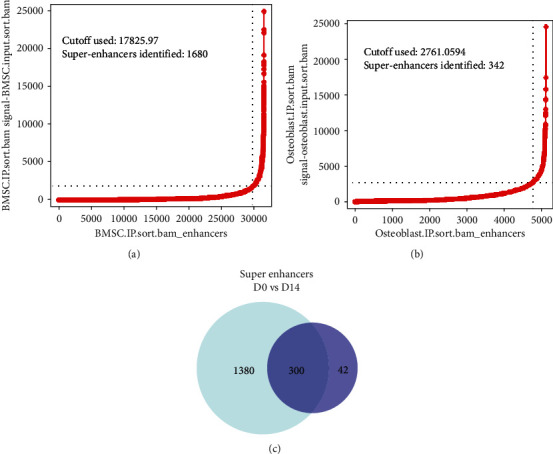
Figure 2.

Super-enhancers in BMSCs (D0 group) and osteoblasts (D14 group). (a) Distribution of ChIP-seq density across enhancers with 1680 SEs and a cutoff value of 17825.97 in the D0 group (ranked by H3K27ac signal. (b) Distribution of ChIP-seq density across enhancers with 342 SEs and a cutoff value of 2761.06 in the D14 group (ranked by H3K27ac signal. (c) The comparison of D0 group and D14 group super-enhancers.
