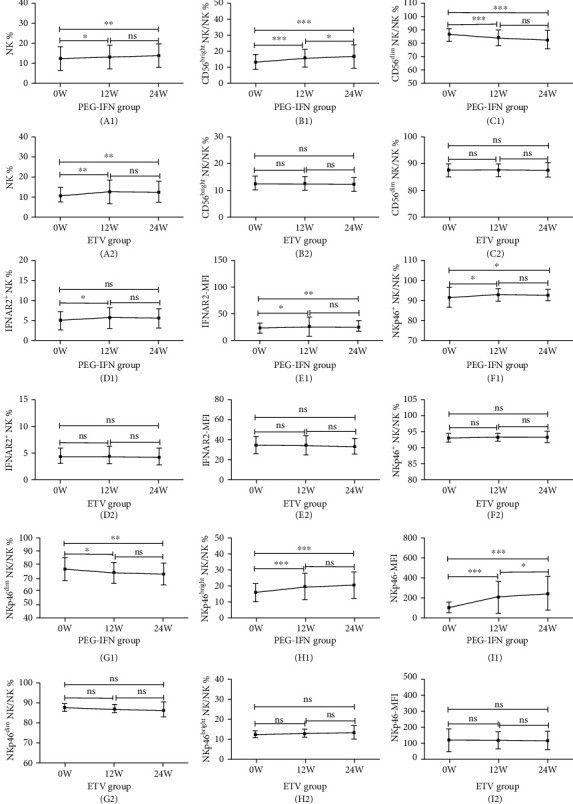
Figure 3.

Tendencies of the frequencies and function of NK cells and their subpopulations before treatment and after therapy weeks 12 and 24 in the PEG-IFN and ETV group. The parameters include NK% (A1, A2), CD56bright NK% (B1, B2), CD56dim NK% (C1, C2), IFNAR2+ NK% (D1, D2), IFNAR2-MFI (E1, E2), NKp46+ NK% (F1, F2), NKp46bright NK% (G1, G2), NKp46dim NK% (H1, H2) cells, and NKp46-MFI (I1, I2). ∗P < 0.05; ∗∗P < 0.01; ∗∗∗P < 0.001; ns: not significant.
