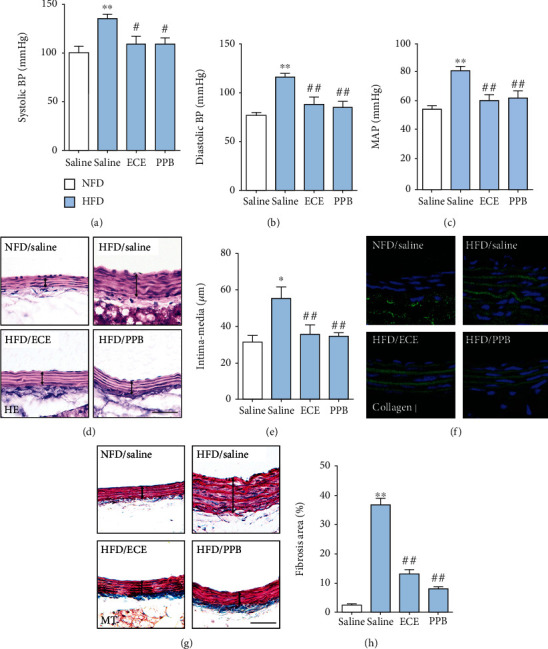
Figure 6.

Comparative analysis of ECE and PPB administration on the regulation of blood pressure in HFD-fed animals. (a) Systolic and (b) diastolic blood pressures and (c) mean artery pressures (MAP) were measured prior to sacrifice. (d, e) Hematoxylin and eosin- (HE-) stained light microscopic images showing intima-media thickness of the aorta (black line) and the thickness acquired using representative HE-stained images. Scale bar = 50 μm. (f) Immunofluorescent images showing collagen Ι (green, DAPI; blue) expression of the aorta and (g, h) Masson's trichrome- (MT-) stained light microscopic images showing fibrosis (blue) of the intima-media area of the aorta (black line) and the fibrosis area acquired using representative MT-stained images. Scale bar = 50 μm. ∗vs. NFD/saline, #vs. HFD/saline.
