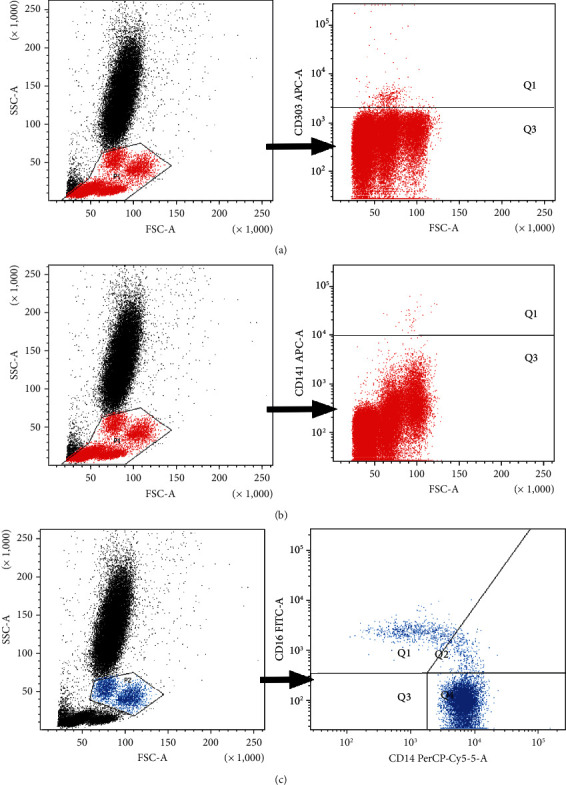
Figure 1.

Exemplary plots of flow cytometry analysis showing the gating strategy of analyzed leukocyte populations. (a) Distribution of cellular populations in forward and side scatter (FSC-SSC) picture, PBMCs gated for further DC analysis (gate P1), and exemplary plots of flow cytometry analysis showing the staining with antibodies specific for pDCs in mononuclear leukocyte fraction: BDCA2/CD303 pDCs (quadrant Q1). (b) Distribution of cellular populations in forward and side scatter (FSC-SSC) picture, PBMCs gated for further DC analysis (gate P1), and exemplary plots of flow cytometry analysis showing the staining with antibodies specific for mDCs in mononuclear leukocyte fraction: BDCA3/CD141 mDCs (quadrant Q1). (c) Distribution of cellular populations in forward and side scatter (FSC-SSC) picture, monocytes gated for further analysis (gate P2, blue population), and exemplary plots of flow cytometry analysis showing the staining with antibodies specific for CD14 and CD16 in monocyte fraction. Gating of individual monocyte subpopulations is presented: monocytes (CD14highCD16−) (quadrant Q4), monocytes (CD14highCD16+) (quadrant Q2), and monocytes (CD14lowCD16+) (quadrant Q1).
