Figure 3.

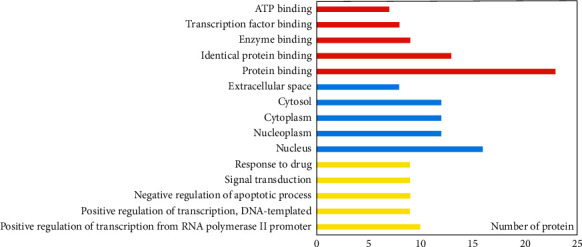
GO analysis by DAVID: red represents the biological process, yellow represents the cellular component, green represents the molecular function.

GO analysis by DAVID: red represents the biological process, yellow represents the cellular component, green represents the molecular function.