FIG 2.
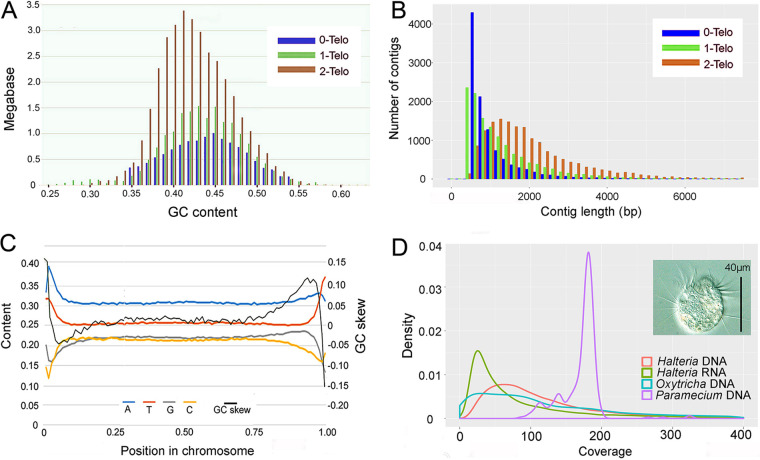
Features of the transcriptome-like genome of Halteria. (A) Distribution of GC content across total lengths of 0-, 1-, and 2-telomere contigs. (B) Length distribution of contigs with 0, 1, and 2 telomeres. (C) Sliding-window analysis of nucleotide content. Window size was 1% of the whole chromosome, excluding telomeres. Only the coding strands of single-gene coding chromosomes were used. GC skew: (G−C)/(G+C). (D) Distribution of RNA coverage level of all contigs in Halteria, and distribution of DNA coverage level for all contigs in Halteria, Oxytricha, and Paramecium genomes (density plot, with the area under each curve normalized to 1.0). All data sets were normalized to the same average coverage level by controlling the total reads number. A microphotograph of a living Halteria is shown.

