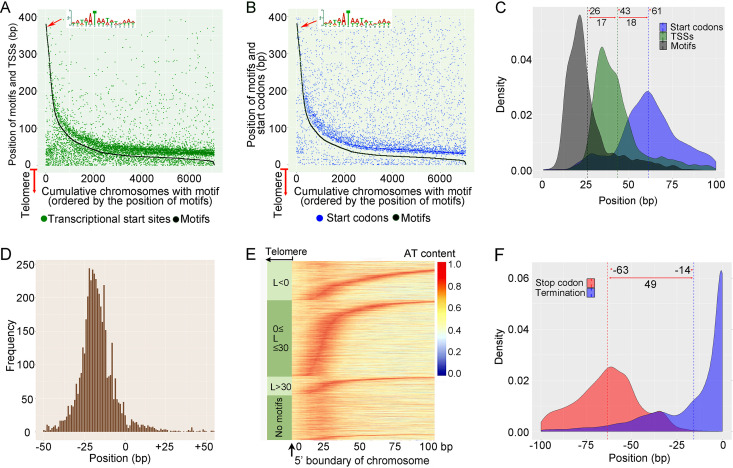
FIG 5.
Transcription initiation and termination in tiny chromosomes. (A) Locations of TATA box-like motif and transcription start site in each of 7,061 single-gene chromosomes measured from the end of the 5′ telomere. On the x axis, from 0 to 7,061, all 7,061 single-gene chromosomes are ordered by decreasing distance of the TATA box like motifs from the telomere. The y axis denotes the position of motifs (black dots, joined as a line) or transcription start sites (green dots); 0 on the y axis represents the 5′ boundary of the chromosome (i.e., the motif is adjacent to the telomere). (B) Locations of TATA box-like motifs and translation start codons in each single-gene chromosome measured from the end of the 5′ telomere, as in Fig. 5A (C). The frequency distributions of positions of translation start codons (blue), transcription start sites (green), and TATA box-like motifs (gray), measured as the distance from the 5′ boundary of chromosomes (telomeres excluded). The dashed lines indicate the mean values. (D) Frequency profile of TATA box-like motifs within the region from −50 to +50 relative to the TSS (0). (E) Sliding-window analysis of AT content of 100-bp 5′ subtelomeric regions of single-gene coding chromosomes separated into four groups (based on the position of the TATA box-like motif and first mapped RNA read). The window size for calculating the AT content is 20 bp. The 0-bp location on the x axis is the 5′ boundary of the chromosome after removing telomeres. Each row represents a chromosome. In each group, chromosomes are ordered by the position of their motifs; the group without a TATA box-like motif is in random order. (F) The frequency distribution of translation stop codons (red) and transcription termination sites (blue), measured as the distance from the 3′ boundary of the chromosome (telomeres excluded). The dashed lines indicate the mean values.

