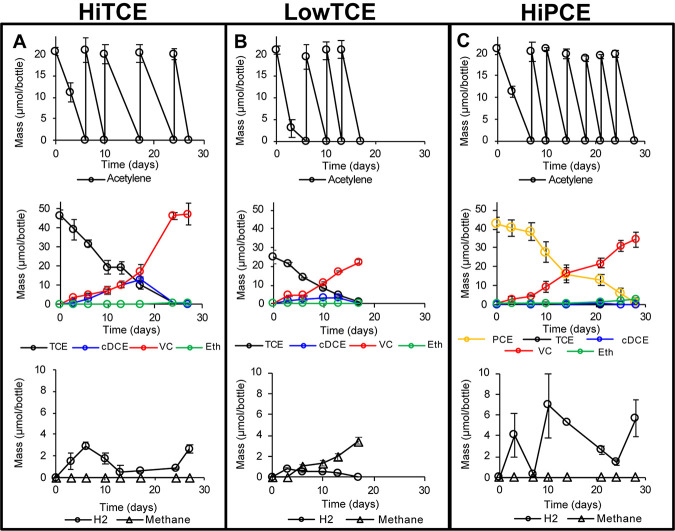
FIG 1.
C2H2 consumption (top row), ethene and chlorinated ethene consumption and production (middle row), and H2 and methane production (bottom row) for HiTCE (A), LowTCE (B), and HiPCE (C) growth conditions. Quantities shown in total mass (dissolved plus headspace) per 160-ml serum bottle (100-ml liquid volume). Each acetylene peak denotes external amendment of acetylene. Error bars represent 1 standard deviation of experimental triplicates.

