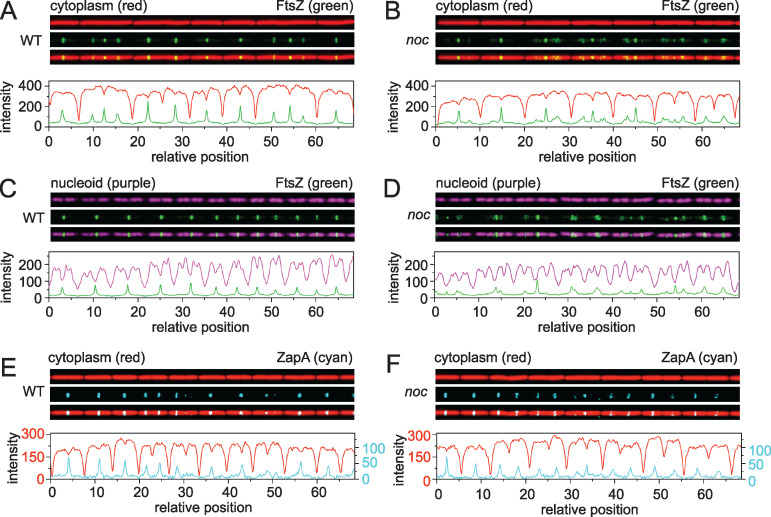
FIG 1.
Microfluidic analysis of growth, division, and chromosome segregation in the wild type and noc mutants. Fluorescence microscopy of the wild type (A, C, E) and noc mutants (B, D, F) growing at steady state in a microfluidic channel. (A and B) Fluorescence microscopy of the wild type (DK5133) (A) and the noc mutant (DK5820) (B). Cytoplasmic mCherry false colored red (top), mNeongreen-FtsZ false colored green (middle), and an overlay of the two colors (bottom) are shown. Graphs are a quantitative analysis of mCherry fluorescence intensity (red line) and mNeongreen fluorescence intensity (green line) to match the fluorescence images immediately above. (C and D) Fluorescence microscopy of the wild type (DK5712) (C) and a noc mutant (DK6372) (D). Chromosomal HBsu-mCherry false colored purple (top), mNeongreen-FtsZ false colored green (middle), and an overlay of the two colors (bottom) are shown. Graphs are a quantitative analysis of mCherry fluorescence intensity (purple) and mNeongreen fluorescence intensity (green) to match the fluorescence images immediately above. (E and F) Fluorescence microscopy of the wild type (DK 8138) (E) and a noc mutant (DK8172) (F). Cytoplasmic mCherry false colored red (top), ZapA-mNeongreen false colored cyan (middle), and an overlay of the two colors (bottom) are shown. Graphs are a quantitative analysis of mCherry fluorescence intensity (red) and mNeongreen fluorescence intensity (cyan) to match the fluorescence images immediately above. For panels E and F, two different y axes are used due to lower fluorescence intensity from the ZapA-mNeongreen construct. The left axis corresponds to the mCherry signal (red), and the right axis corresponds to the ZapA-mNeongreen signal (cyan). All images are reproduced at the same magnification.

