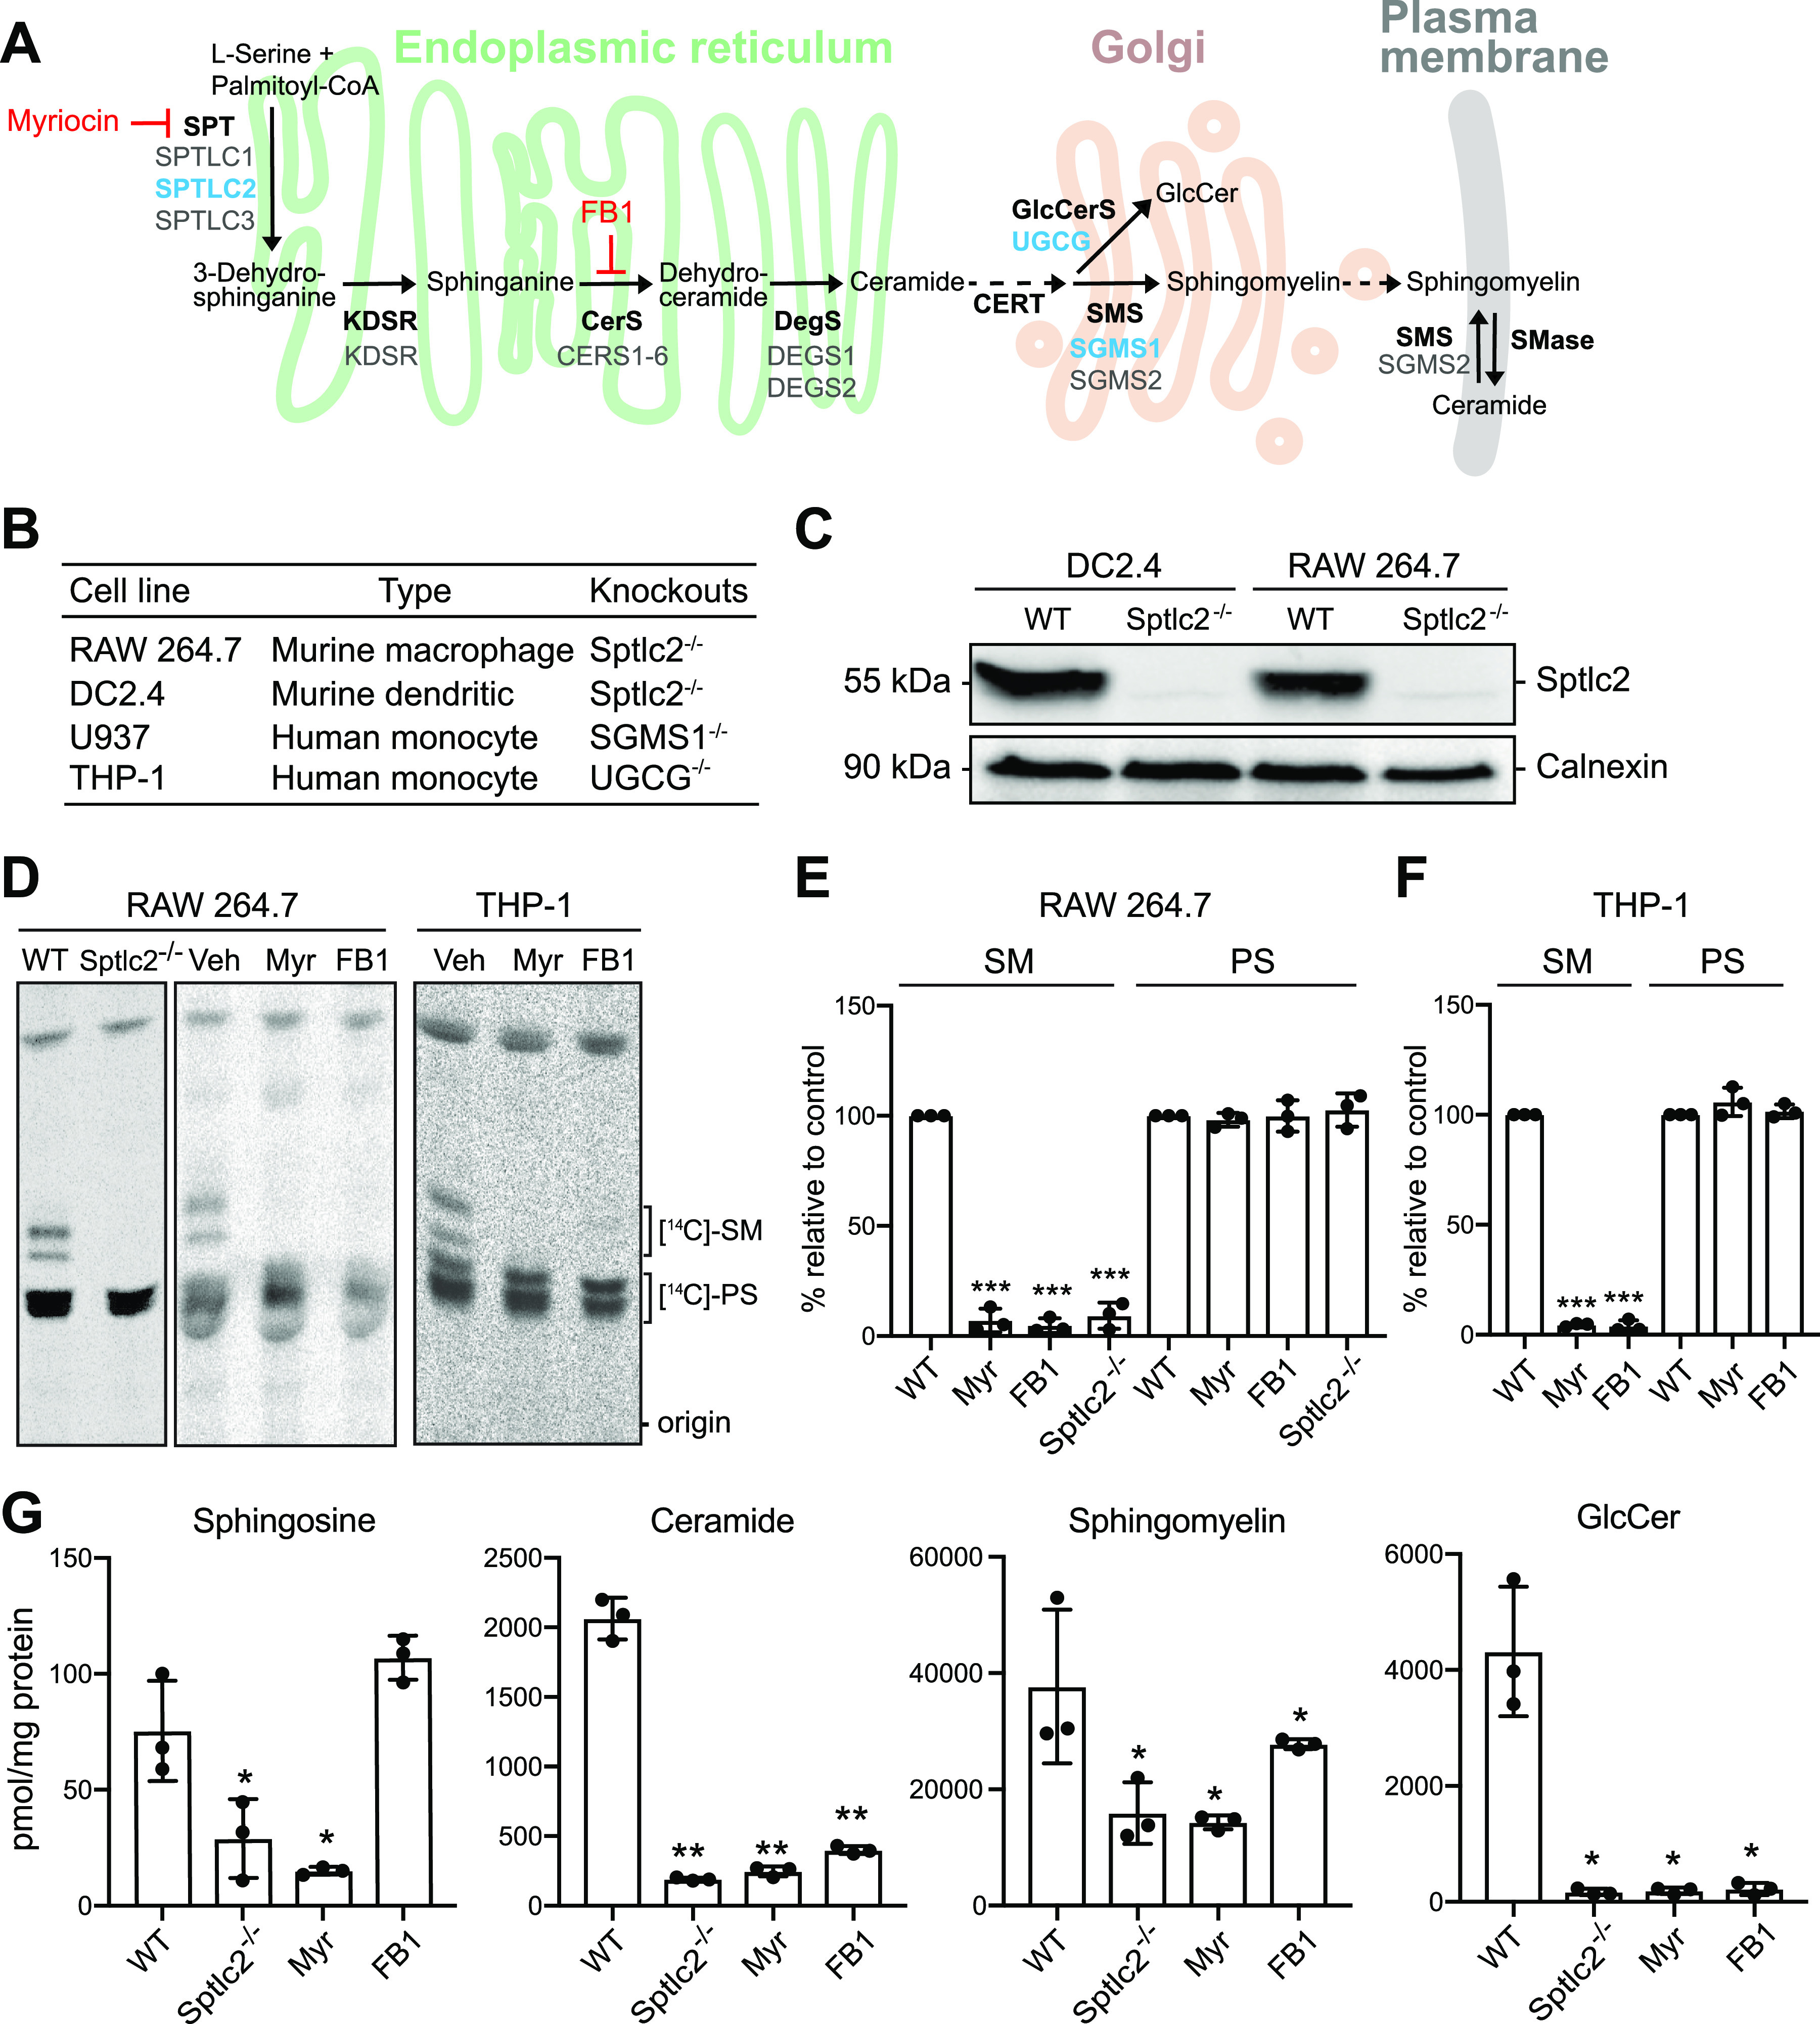
FIG 1.

Manipulation of cellular sphingolipid levels using genetics and chemical tools. (A) Schematic outline of the sphingolipid biosynthetic pathway. Inhibitors of sphingolipid biosynthetic enzymes used in this study are in red. Genes deleted using CRISPR/Cas9 are in blue. SPT, serine palmitoyltransferase; KDSR, 3-ketodihydrosphingosine reductase; CerS, ceramide synthase; DegS, δ4-desaturase; GlcCerS, glucosylceramide synthase; SMS, sphingomyelin synthase; FB1, fumonisin B1. (B) Phagocytic cell lines used in this study. (C) DC2.4 and RAW264.7 wild-type (WT) and Sptlc2−/− cells were processed for immunoblotting with antibodies against Sptlc2 and calnexin. (D) Sptlc2−/− and wild-type RAW264.7 or THP-1 cells were treated with myriocin or fumonisin B1 for 3 days and then metabolically labeled with 3-l-[14C]serine for 4 h. Total lipids were extracted and analyzed by thin-layer chromatography (TLC) and autoradiography. Veh, vehicle treated. (E and F) Quantification of [14C]SM and [14C]PS signals from TLCs shown in panel D. (G) Wild-type, Sptlc2−/−, and inhibitor-treated RAW264.7 cells were subjected to total lipid extraction. Sphingosine, ceramide, sphingomyelin, and glucosylceramide (GlucCer) levels were quantified by LC-MS/MS. Data are means ± standard deviations (SD) (n = 3). *, P < 0.05; **, P < 0.01; ***, P < 0.001 (two-tailed unpaired t test).
