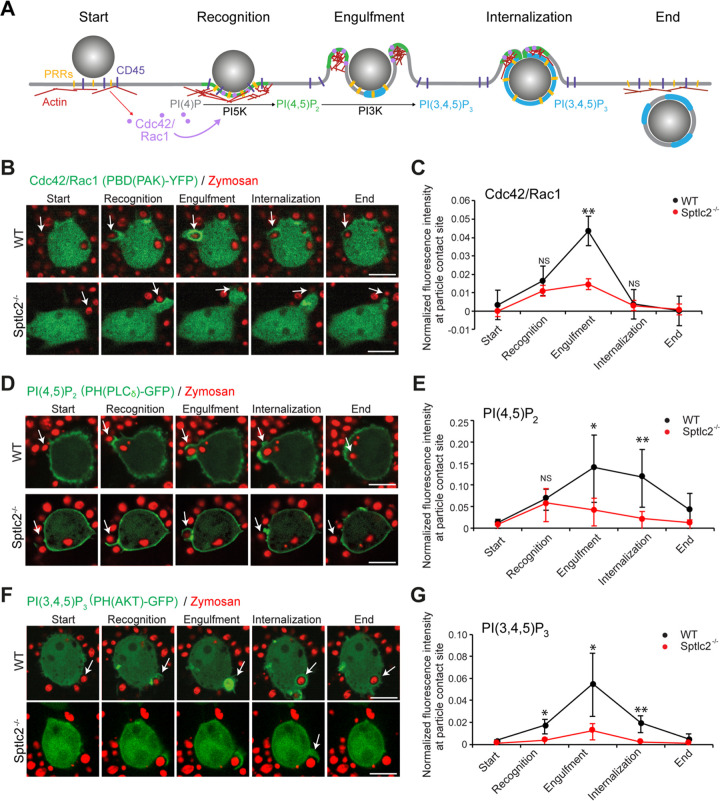
FIG 5.
Sptlc2−/− cells display an impaired phosphoinositide turnover at the phagocytic cup. (A) Schematic outline of molecular events underlying phagocytosis. Engagement of pattern recognition receptors (PRRs) with a pathogen initiates receptor clustering at the phagocytic cup, followed by a lateral segregation of the inhibitory CD45 phosphatase. This results in activation of the Rho GTPases Cdc42 and Rac1, which, in turn, stimulate PI5K activity to enable local production of PI(4,5)P2 and promote actin assembly. Next, PI3K orchestrates the turnover of PI(4,5)P2 to PI(3,4,5)P3, leading to actin disassembly at the base of the phagosome, a process required to complete the engulfment and internalization of the pathogen. (B) Time-lapse confocal images of wild-type and Sptlc2−/− RAW264.7 cells transfected with Cdc42 activity biosensor PAK(PBD)-GFP (green) and incubated with zymosan beads (red) at an MOI of 10. (C) Quantification of the PAK(PBD) fluorescence intensity in the course of phagocytic cup formation in cells treated as for panel B. (D) Time-lapse confocal images of wild-type and Sptlc2−/− RAW264.7 cells transfected with the PI(4,5)P2 biosensor PH(PLCδ)-GFP (green) and incubated with zymosan beads (red) as for panel B. (E) Quantification of the PH(PLCδ) fluorescence intensity in the course of phagocytic cup formation in cells treated as for panel D. (F) Time-lapse confocal images of wild-type and Sptlc2−/− RAW264.7 cells transfected with the PI(3,4,5)P3 biosensor PH(AKT)-GFP (green) and incubated with zymosan beads (red) as for panel B. Bar, 5 μm. (G) Quantification of the PH(AKT) fluorescence intensity in the course of phagocytic cup formation in cells treated as for panel F. Note that only a small fraction of the beads recognized by Sptlc2−/− mutant cells were internalized, in contrast to wild-type cells. Therefore, for Sptlc2−/− mutant cells, the normalized fluorescence intensity was determined at the particle contact site at time points equivalent to those at which particle recognition, engulfment, and internalization took place in wild-type cells. The GFP signal at the particle contact site was quantified and divided by the value for the GFP threshold of the whole cell at the corresponding time point. Average intensity profiles of 5 to 10 cells taken from two independent biological experiments are shown. Data are means ± SD. *, P < 0.05; **, P < 0.01; ns, not significant (two-tailed unpaired t test).

