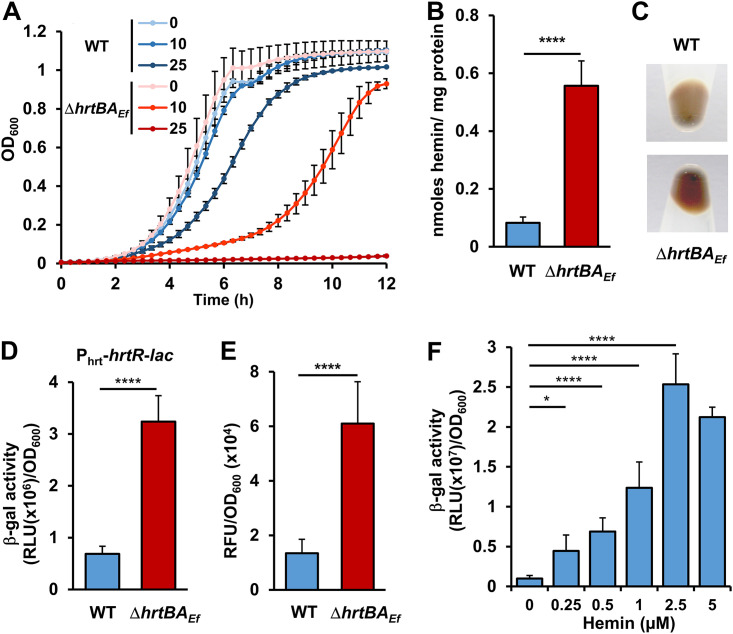
FIG 1.
HrtBAEf controls and responds to heme intracellular concentration. (A) Deletion of hrtBAEf increases sensitivity to hemin toxicity. Overnight cultures of WT and ΔhrtBAEf strains were diluted to an OD600 of 0.01 and grown with the indicated concentrations of hemin (in micromolar) for 10 h at 37°C in a microplate Spark spectrophotometer (Tecan). OD600 was measured every 20 min. Values are the means ± standard deviations (error bars) from three biological replicates. (B) Heme accumulates in the ΔhrtBAEf strain. WT and ΔhrtBAEf strains were grown to an OD600 of 0.5 prior to the addition of 5 μM hemin in the culture medium for an additional 1.5 h. Bacteria were pelleted by centrifugation, and heme content was determined by the pyridine hemochrome assay on cell lysates. Heme content was normalized to the protein concentration. Background from bacteria not incubated with hemin was subtracted. Results represent the means plus standard deviations (error bars) from three biological replicates. Statistical significance was determined by t test where **** = P < 0.0001. (C) Visualization of cellular heme accumulation in the ΔhrtBAEf mutant. Cells, grown as described above for panel A, were incubated for 1.5 h with 5 μM hemin. The bacteria were photographed following centrifugation. The results are representative of three independent experiments. (D) HrtBAEf reduces heme cytoplasmic concentration. WT and ΔhrtBAEf strains carrying the intracellular sensor plasmid, pPhrt-hrtR-lac were grown as described above for panel B. β-Gal activity was quantified by luminescence in relative light units [RLU]) after 1.5 h of incubation with 5 μM hemin. Results represent the means plus standard deviations from three biological replicates. Statistical significance was determined by t test where **** = P < 0.0001. (E) HrtBAEf prevents hemin-induced oxidative stress. WT and ΔhrtBAEf strains were grown as described above for panel B with 5 μM hemin. Cells were washed with PBS plus 0.5% glucose, and ROS generation was quantified by the fluorescence of dihydrorhodamine 123. Results represent the means plus standard deviations from three biological replicates. Fluorescence background from bacteria not incubated with hemin was subtracted. Statistical significance was determined by t test where **** = P < 0.0001. (F) Induction of hrtBAEf operon by hemin. The WT strain transformed with the reporter plasmid pPhrtBA-lac was grown, and β-gal activity was determined as described above for panel D following incubation with the indicated concentrations of hemin. Results represent the means ± standard deviations from three biological replicates. Statistical significance was determined by one-way analysis of variance (ANOVA) with Dunnett’s multiple-comparison test comparing each concentration of hemin to no-hemin control with statistical significance indicated as follows: *, P = 0.0202; ****, P < 0.0001.

