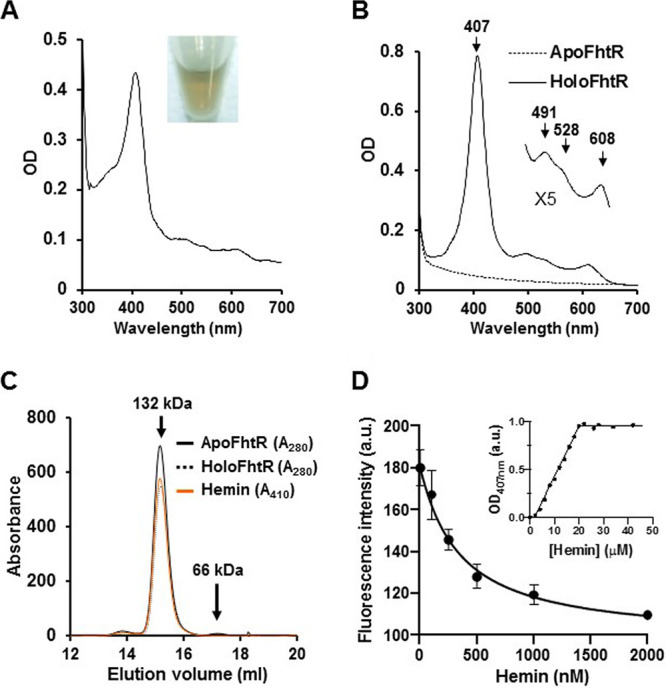
FIG 3.

FhtR binds heme. (A) UV-visible absorption spectra of MBP-FhtR as purified from E. coli. UV-visible spectra of 30 μM (in 200 μl) MBP-FhtR was obtained in a microplate spectrophotometer (Spark; Tecan) and normalized to an OD280 of 1. (Inset) Photograph of the purified MBP-FhtR. Results are representative of three independent experiments. (B) UV-visible spectra of apoMBP-FhtR complexed with hemin. MBP-FhtR was purified from E. coli (hemA::kan) strain as an apoprotein (dashed line) that was mixed with equimolar concentration of hemin. Spectra was obtained as described above for panel A with 20 μM complex and normalized to an OD280 of 1. (Inset) Magnification of the 500- to 700-nm region. Results are representative of three independent experiments. (C) Size-exclusion chromatography of apo- and holo-MBP-FhtR. MBP-FhtR was purified and complexed with hemin as described above for panel B. 40 μM of the complex in 100 μl was loaded on a Superdex 200 Increase 10/300 GL gel filtration column (GE Healthcare) in 20 mM HEPES (pH 7), 300 mM NaCl buffer. Protein and heme content were analyzed at OD280 and OD410. The results are representative of three independent experiments. (D) Titration of MBP-FhtR with hemin followed by fluorescence and absorbance (inset). For the fluorescence experiment, 50 nM ApoMBP-FhtR purified from E. coli (hemA::kan) as described for panel B were titrated with increasing increments of hemin. Fluorescence intensity (in arbitrary units [a.u.]) was recorded and plotted against hemin concentration. The experiment was repeated three times, fitted using the nonlinear regression function of GraphPad Prism 4 software, and gave a Kd of 310 nM. The inset depicts the absorbance at 407 nm of ApoMBP-FhtR plotted against hemin concentration. The curve is representative of 10 independent experiments and was fitted using the nonlinear regression function of GraphPad Prism 4 software, which determined that the stoichiometry of the FhtR-hemin complex was 1:1.
