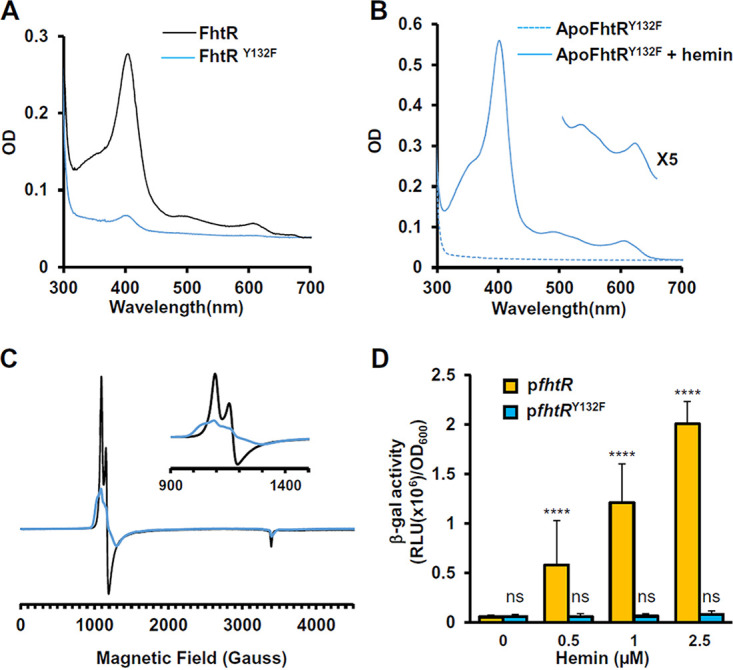
FIG 4.

Ligation of FhtR with hemin implicates the tyrosine Y132. (A) Comparative UV-visible absorption spectra of 20 μM MBP-FhtR and MBP-FhtRY132F purified from E. coli. UV-visible spectra were performed as described in the legend to Fig. 3A. The results are representative of three independent experiments. (B) UV-visible spectra of apoMBP-FhtRY132F complexed with hemin. MBP-FhtRY132F was purified from E. coli (hemA::kan) strain as an apoprotein (dashed line) that was mixed with equimolar concentration of hemin (holoMBP-FhtR). Spectra were obtained as described for panel A with 20 μM complex and normalized to an OD280 of 1. (Inset) Magnification of the 500- to 700-nm region. Results are representative of three independent experiments. (C) EPR spectroscopy of MBP-FhtR and MBP-FhtRY132F in complex with hemin. EPR spectra of 60 μM bound hemin to WT (black line) and Y132 mutant (blue line) MBP-FhtR in 20 mM HEPES (pH 7) and 300 mM NaCl were recorded. (Inset) Magnification of the 900- to 1,500-gauss magnetic field range. The results are representative of three independent experiments. (D) Induction of the hrtBAEf operon by hemin. β-gal activity from the ΔfhtR strain transformed either with pPhrtBA-lac, PfhtR-fhtR or pPhrtBA-lac, or PfhtR-fhtRY132F was determined as described in the legend to Fig. 1C following incubation with the indicated concentrations of hemin. Results represent the means plus standard deviations from three biological replicates. Statistical significance was determined by one-way analysis of variance (ANOVA) with Dunnett’s multiple-comparison test comparing each concentration of hemin to pfhtR (0 μM) control with statistical significance indicated as follows: ns, not significant (P > 0.5); ****, P < 0.0001.
