FIG 2.
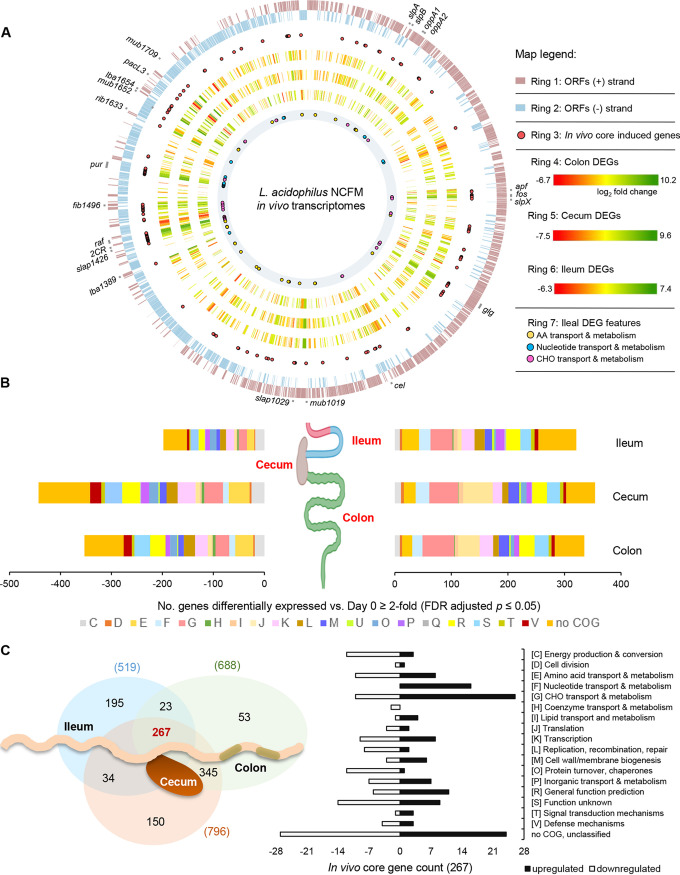
In vivo core and spatial transcriptomes of L. acidophilus NCFM. (A) Circular genome representation of differentially expressed genes (DEGs) in the ileum, cecum, and colon with the corresponding fold change in expression values mapped to the NCFM chromosome (GenBank accession number NC_006814) (rings 4 to 6). A core upregulated gene set (134 genes) mapped to the chromosome (ring 3, red circles) revealed the presence of gene clusters or genomic “hot spots” that were highly transcribed under in vivo conditions. Upregulated genes involved in carbohydrate, amino acid, and nucleotide transport and metabolism in the ileal population were represented in ring 7. Selected key gene features were highlighted in the outer ring. Genome mapping and visualization of DEGs were performed using the CiVi tool (65). ORFs, open reading frames; AA, amino acid; CHO, carbohydrate. (B) Stacked bar graph depicting the number and functional distribution of the differentially regulated genes in the ileum, cecum, and colon based on COG classification (see panel C). (C) Venn diagram illustrating spatial distribution of the differentially expressed genes in the gut niches (left), with further emphasis on the functional distribution of the core genes depicted in the bar graph (right). fos, FOS utilization; glg, glycogen metabolism; cel, cellobiose utilization; 2CR, bile-inducible two-component regulatory system LBA1430-1431; raf, raffinose utilization; pur, purine biosynthesis.

