
Fig. 5.
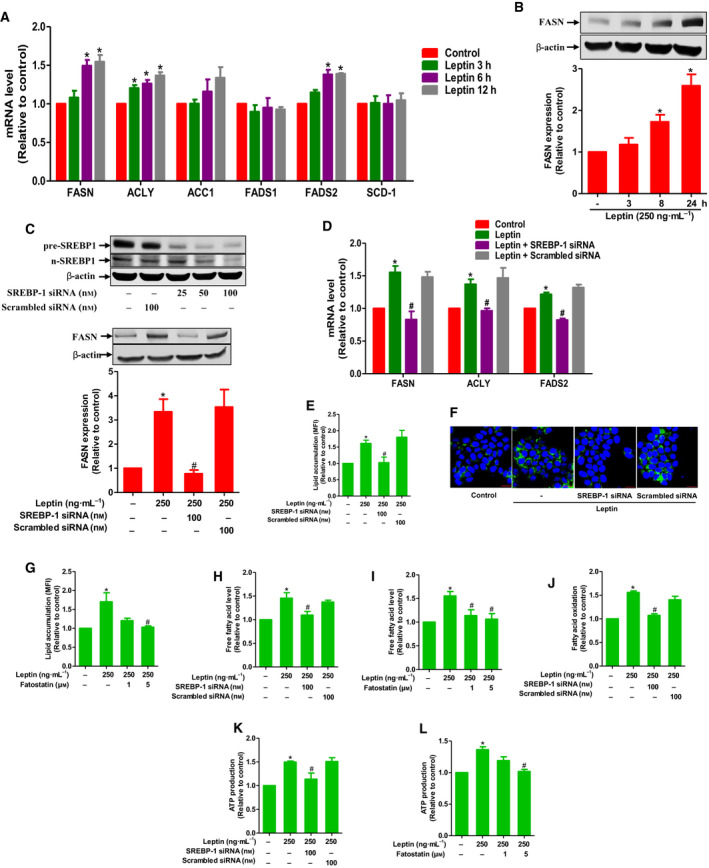
The role of SREBP‐1 in alterations of the fatty acid metabolism induced by leptin in breast cancer cells. (A, B) MCF‐7 cells were treated with leptin for indicated time periods. Messenger RNA levels of genes of interest were analyzed using RT‐qPCR (A). FASN protein expression was measured by western blot analysis (B). (C) MCF‐7 cells were transfected with siRNA targeting SREBP‐1 followed by further stimulation with leptin for 24 h. (Upper panel) Gene silencing efficiency was monitored by western blot analysis after 48 h of transfection. (Lower panel) Protein expression level of FASN was measured by western blot analysis. (D) MCF‐7 cells were transfected with siRNA targeting SREBP‐1 followed by further stimulation with leptin for 24 h. Messenger RNA levels of the potential target genes were determined by RT‐qPCR. (E–L) MCF‐7 cells were transfected with siRNA targeting SREBP‐1 for 48 h (E, F, H, J, and K) or pretreated with fatostatin (G, I, and L) for 1 h before being incubated with leptin for additional 24 h. (E–G) Lipid accumulation was evaluated by FACS analysis (E, G) and confocal microscopy (scale bar: 20 µm) (F). Representative images from three independent experiments have been presented. (H, I) Intracellular FFA level was determined as described in Materials and methods. (J) FAO assay was performed to measure fatty acid consumption rate. (K, L) Cellular ATP level was analyzed as described in Materials and methods. Values are expressed as the fold change compared with the control and are presented as mean ± SEM, n = 3. *P < 0.05 compared to control; # P < 0.05 compared with the cells treated with leptin only.