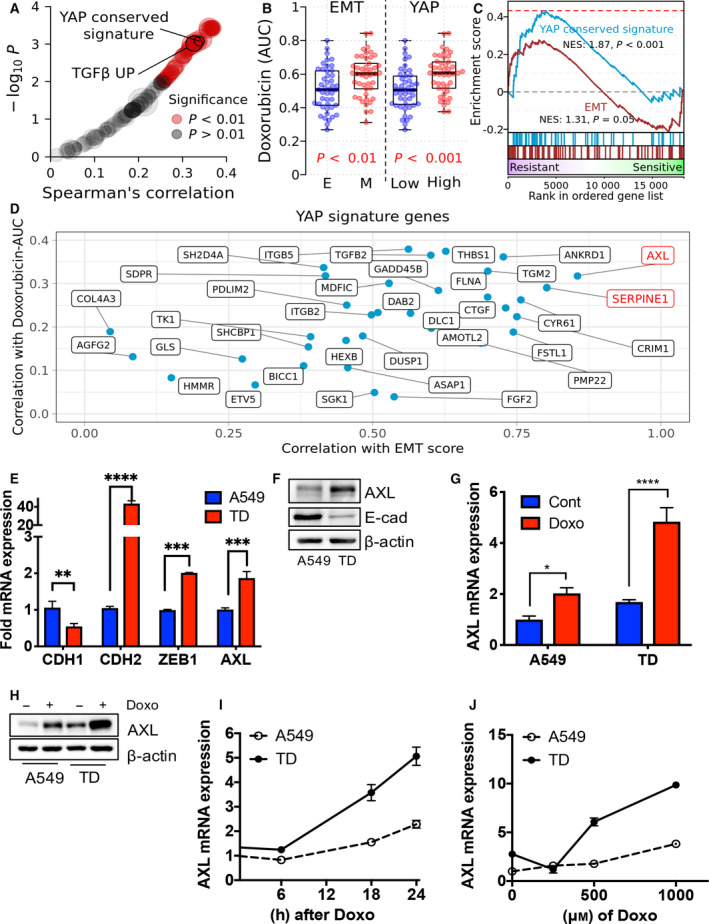
Fig. 2.

Identification of AXL as a player for doxorubicin chemoresistance. (A) Correlation between cell‐line drug sensitivity measurements (AUC) and enrichment score across oncogenic signatures. (B) Distribution of doxorubicin sensitivity by the cell groups of EMT (epithelial: E and mesenchymal: M) and YAP activity (YAP‐low: Low and YAP‐high: High) in lung cancer cell line. P‐values were calculated with two‐tailed t‐tests. (C) GSEA plot of EMT and YAP signatures in a ranked list of genes differentially expressed between doxorubicin‐resistant and doxorubicin‐sensitive cell groups. (D) YAP signature genes scattered by their expression correlation with mesenchymal score and correlation with sensitivity to doxorubicin. (E) Real‐time PCR analysis of each indicative gene in A549 and TD cells. (F) Immunoblotting analysis for indicative proteins in A549 and TD cells, β‐actin for equal protein loading. (G) AXL mRNA expression in A549 and TD cells with or without doxorubicin (Doxo, 1 μm) treatment. (H) Immunoblotting analysis for AXL protein in A549 and TD cells with or without doxorubicin (1 μm) treatment. (I) AXL mRNA expression in A549 and TD cells at the indicative time after doxorubicin (1 μm) treatment. (J) AXL mRNA expression in A549 and TD cells for each concentration of doxorubicin treatment, Mean ± SD, Student’s t‐test, P < 0.05(*), P < 0.01(**), P < 0.001(***) and P < 0.0001(****), n = 3.
