Fig. 7.

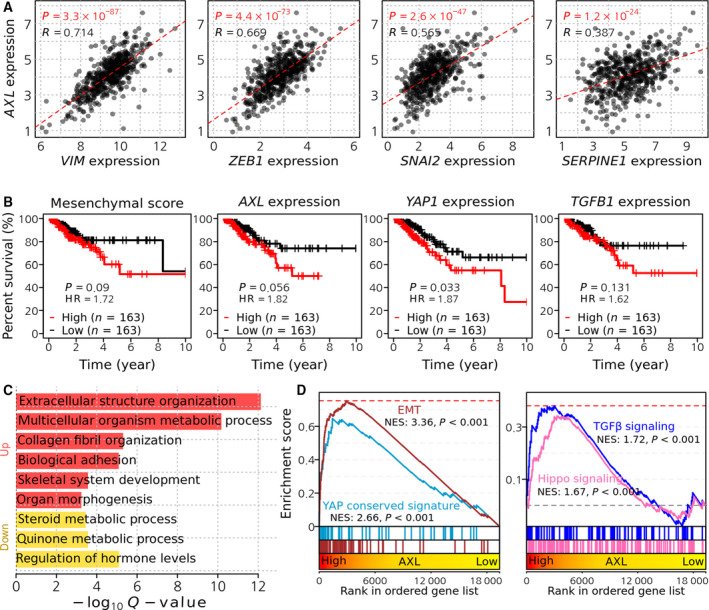
Clinical significance of AXL in the lung cancer patients. (A) Correlation between AXL expression and VIM, ZEB1, SNAI2 and SERPINE1 expression levels in TCGA lung adenocarcinoma patients. (B) Kaplan–Meier curves showing recurrence‐free survival time of lung adenocarcinoma patients. Patients were divided into three groups (high, intermediate, low) by mesenchymal score, expression levels of AXL, YAP1 and TGFB1. High and low groups were used for comparison. (C) Significantly enriched functions in upregulated DEG in high AXL patients. Hypergeometric tests were performed using gene annotation in the biological process of the Gene Ontology database, yielding enrichment scores, defined as −log10 (q‐value). (D) GSEA plots showing the enrichment of EMT and YAP signatures (left) and TGFβ and Hippo signaling pathway (right) in a ranked list of genes differentially expressed between high and low AXL groups in TCGA lung adenocarcinoma patients.
