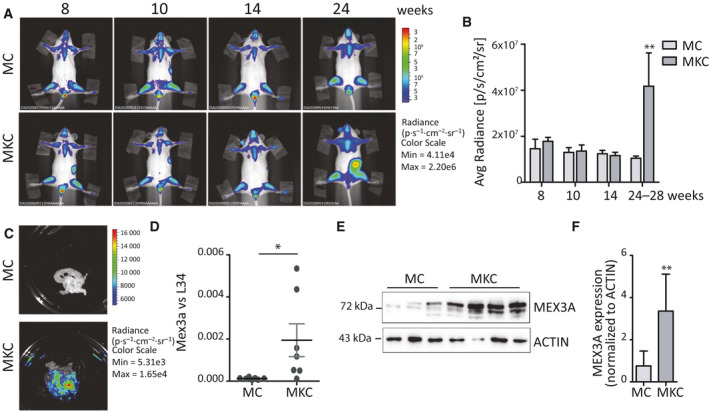
Fig. 3.

MEX3A expression is increased in a mouse model of PDAC. (A) Longitudinal monitoring of PDAC‐associated proliferation by in vivo BLI. Representative images of representative MKC and control MC mice were taken at the indicated weeks. (B) Bar graph showing the mean of the abdominal bioluminescence of MKC (n = 3) and MC (n = 3) mice at the indicated experimental time points. (C) Representative ex vivo BLI image of the isolated pancreas from MC and MKC mice shown in panel B. (D, E) Analysis by qPCR (D) and western blot (E) to evaluate MEX3A expression level in MKC and MC mice. (F) Densitometric analysis of MEX3A protein expression levels (n = 5 for MC mice and n = 9 for MKC mice). Data were normalized for Actin intensity. Statistical analyses were performed by Student's t‐test (C–F). *P ≤ 0.05.
