
Fig. 4(Panel B of this figure has been altered: the numbers in the pie sector should be centered; moreover, the legend is partially hidden by the pie. Please see the original Figure 4 that we have attached here for reference).
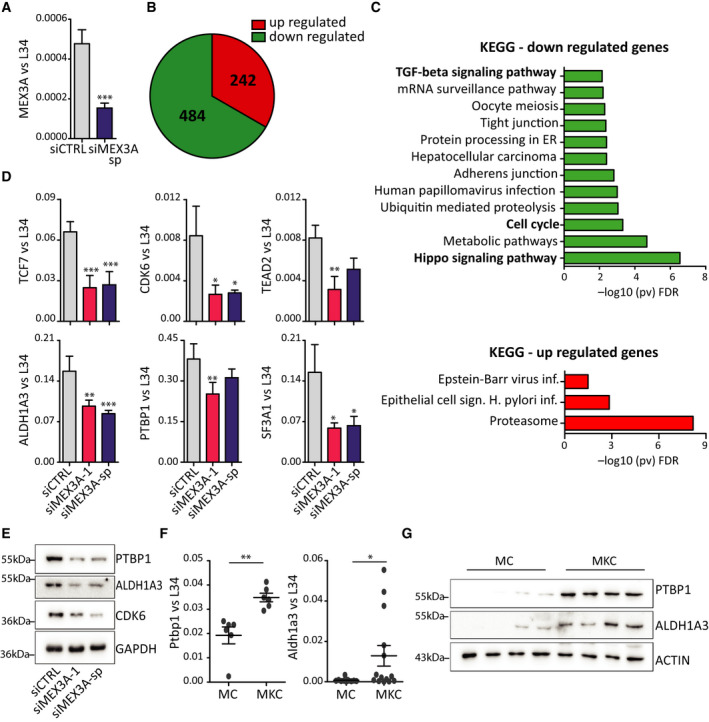
MEX3A regulates genes involved in cell cycle progression in PDAC cells. (A) Analysis by qRT‐PCR of MEX3A expression in MiaPaCa‐2 cells transfected with MEX3A‐sp siRNAs or control siRNAs and used for the RNA‐seq experiment (n = 4). (B) Pie chart of genes that are up‐ and down‐regulated in MiaPaCa‐2 cells depleted of MEX3A identified by the RNA‐seq analysis. (C) Gene ontology (KEGG) of up‐ and down‐regulated genes in MiaPaCa‐2 cells depleted of MEX3A performed by using the g‐profiler web server. (D) Validation by qRT‐PCR of the effect of MEX3A depletion on selected target genes. MEX3A depletion was performed by using two separate siRNA sets (siMEX3A‐1 and siMEX3A‐sp). (E) Western blot analysis of the expression of MEX3A targets (PTBP1, ALDH1A3 and CDK6) in MiaPaCa‐2 cells. (F, G) Analysis by qPCR (F) and western blot (G) of the expression of MEX3A target genes (Ptbp1 and Aldh1a3) in MKC and MC mice. Statistical analyses were performed by Student's t‐test (A–F) one‐way ANOVA (D). *P ≤ 0.05, **P ≤ 0.01, ***P ≤ 0.001.