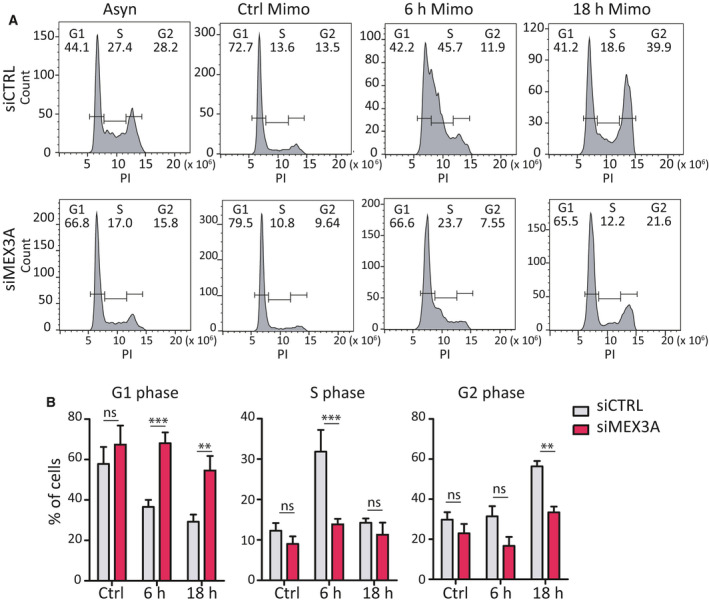
Fig. 7.

MEX3A acts on transition G1/S phase of cell. (A) FACS analysis showing DNA content (PI) of MiaPaCa‐2 cells after release from mimosine synchronization in cells transfected with CTRL or MEX3A siRNAs. (B) Bar graphs show the percentage of cells in G1, S, and G2 phase of cell cycle by FACS analysis of panels shown in (A). Statistical analyses were performed by two‐way ANOVA (B). **P ≤ 0.01, ***P ≤ 0.001.
