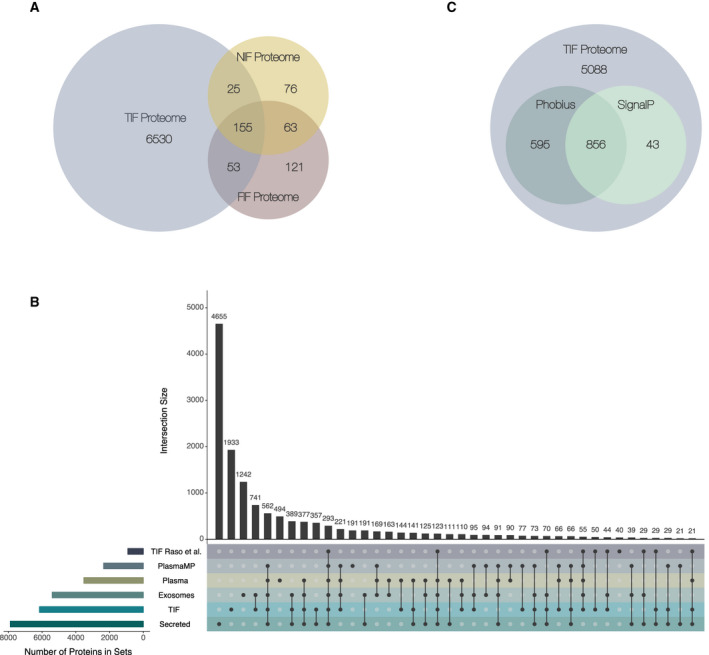
Fig. 2.

Overall characterization of the TIF dataset. Both a comparison of secretome‐related datasets and an evaluation of the secretion pathway were performed. (A) Venn diagram of the overlap between proteins identified within TIF samples and within pooled NIF and FIF samples. (B) An Upset plot illustrates the overlap of the final set of 6763 TIF proteins, 6066 unique gene symbols, included in further analyses with: (a) human plasma—PeptideAtlas database proteins [39]; (b) human exosomal proteins from the ExoCarta database (http://www.exocarta.org; [40] (c) a dataset of proteins associated with circulating human plasma microparticles [41]; (d) a secretome of 11 BC cell lines of different origins [42]; and (e) an interstitial fluid BC protein complement published by Raso et al. [31]. Colors denote the individual protein datasets. Horizontal bars indicate the size of each dataset; vertical bars indicate the number of proteins shared between all combinations of the six sets. (C) Venn diagram showing how many TIF proteins are predicted by SignalP [45, 103] and/or Phobius [46] to encompass a signal peptide.
