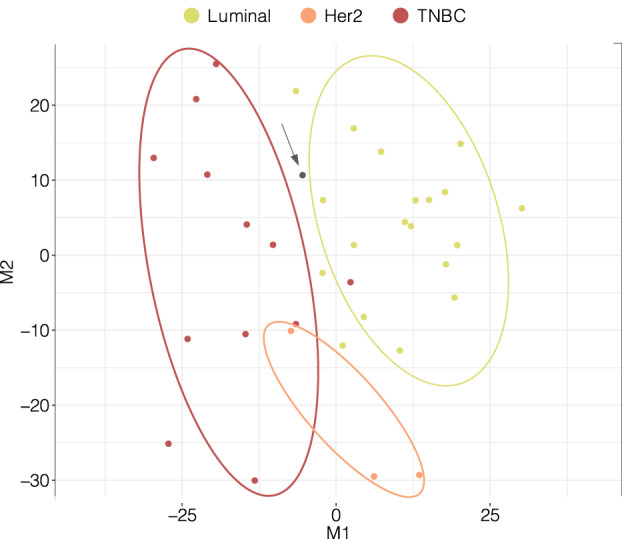
Fig. 3.

Multidimensional scaling plot of 35 BC TIF samples according to subtype based on protein abundances. The x‐axis and y‐axis denote multidimensional scaling components 1 (M1) and 2 (M2), respectively, which best retain the distance relationship (squared Euclidian) between the samples in two‐dimensional space. The single gray dot indicated with an arrow represents a Her2 outlier sample (apocrine dysplasia(s) with multiple cyst structures), which was excluded from further analysis.
